Latvian vs Central American Indian Average Family Size
COMPARE
Latvian
Central American Indian
Average Family Size
Average Family Size Comparison
Latvians
Central American Indians
3.11
AVERAGE FAMILY SIZE
0.0/ 100
METRIC RATING
330th/ 347
METRIC RANK
3.35
AVERAGE FAMILY SIZE
100.0/ 100
METRIC RATING
61st/ 347
METRIC RANK
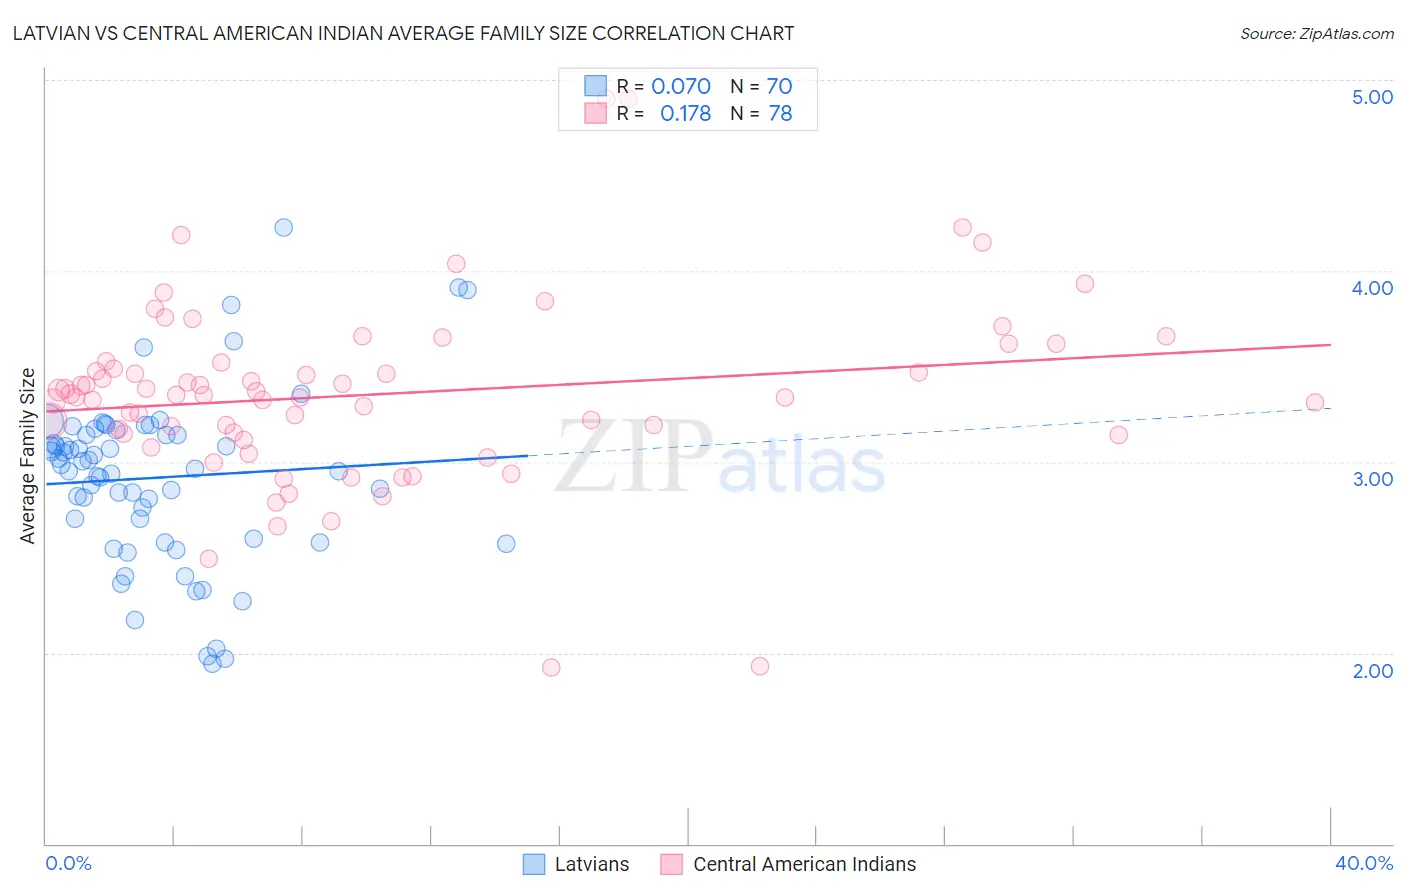
Latvian vs Central American Indian Average Family Size Correlation Chart
The statistical analysis conducted on geographies consisting of 220,660,131 people shows a slight positive correlation between the proportion of Latvians and average family size in the United States with a correlation coefficient (R) of 0.070 and weighted average of 3.11. Similarly, the statistical analysis conducted on geographies consisting of 326,061,161 people shows a poor positive correlation between the proportion of Central American Indians and average family size in the United States with a correlation coefficient (R) of 0.178 and weighted average of 3.35, a difference of 7.8%.
Average Family Size Correlation Summary
| Measurement | Latvian | Central American Indian |
| Minimum | 1.94 | 1.92 |
| Maximum | 4.23 | 4.90 |
| Range | 2.29 | 2.98 |
| Mean | 2.92 | 3.35 |
| Median | 2.97 | 3.35 |
| Interquartile 25% (IQ1) | 2.60 | 3.15 |
| Interquartile 75% (IQ3) | 3.14 | 3.52 |
| Interquartile Range (IQR) | 0.54 | 0.37 |
| Standard Deviation (Sample) | 0.45 | 0.48 |
| Standard Deviation (Population) | 0.45 | 0.48 |
Similar Demographics by Average Family Size
Demographics Similar to Latvians by Average Family Size
In terms of average family size, the demographic groups most similar to Latvians are Scotch-Irish (3.11, a difference of 0.0%), Scottish (3.11, a difference of 0.010%), Estonian (3.10, a difference of 0.050%), Belgian (3.11, a difference of 0.060%), and Lithuanian (3.10, a difference of 0.060%).
| Demographics | Rating | Rank | Average Family Size |
| Soviet Union | 0.0 /100 | #323 | Tragic 3.11 |
| Celtics | 0.0 /100 | #324 | Tragic 3.11 |
| English | 0.0 /100 | #325 | Tragic 3.11 |
| Ottawa | 0.0 /100 | #326 | Tragic 3.11 |
| Dutch | 0.0 /100 | #327 | Tragic 3.11 |
| Czechs | 0.0 /100 | #328 | Tragic 3.11 |
| Belgians | 0.0 /100 | #329 | Tragic 3.11 |
| Latvians | 0.0 /100 | #330 | Tragic 3.11 |
| Scotch-Irish | 0.0 /100 | #331 | Tragic 3.11 |
| Scottish | 0.0 /100 | #332 | Tragic 3.11 |
| Estonians | 0.0 /100 | #333 | Tragic 3.10 |
| Lithuanians | 0.0 /100 | #334 | Tragic 3.10 |
| Luxembourgers | 0.0 /100 | #335 | Tragic 3.10 |
| Irish | 0.0 /100 | #336 | Tragic 3.10 |
| Swedes | 0.0 /100 | #337 | Tragic 3.10 |
Demographics Similar to Central American Indians by Average Family Size
In terms of average family size, the demographic groups most similar to Central American Indians are Immigrants from Armenia (3.35, a difference of 0.030%), Japanese (3.35, a difference of 0.050%), Honduran (3.35, a difference of 0.14%), Sri Lankan (3.35, a difference of 0.15%), and Immigrants from Grenada (3.34, a difference of 0.19%).
| Demographics | Rating | Rank | Average Family Size |
| Immigrants | South Eastern Asia | 100.0 /100 | #54 | Exceptional 3.36 |
| Immigrants | Honduras | 100.0 /100 | #55 | Exceptional 3.36 |
| Immigrants | Dominican Republic | 100.0 /100 | #56 | Exceptional 3.35 |
| Sri Lankans | 100.0 /100 | #57 | Exceptional 3.35 |
| Hondurans | 100.0 /100 | #58 | Exceptional 3.35 |
| Japanese | 100.0 /100 | #59 | Exceptional 3.35 |
| Immigrants | Armenia | 100.0 /100 | #60 | Exceptional 3.35 |
| Central American Indians | 100.0 /100 | #61 | Exceptional 3.35 |
| Immigrants | Grenada | 100.0 /100 | #62 | Exceptional 3.34 |
| Chinese | 100.0 /100 | #63 | Exceptional 3.34 |
| Dominicans | 99.9 /100 | #64 | Exceptional 3.34 |
| Immigrants | Laos | 99.9 /100 | #65 | Exceptional 3.34 |
| Immigrants | St. Vincent and the Grenadines | 99.9 /100 | #66 | Exceptional 3.34 |
| Immigrants | Jamaica | 99.9 /100 | #67 | Exceptional 3.33 |
| Immigrants | Cambodia | 99.9 /100 | #68 | Exceptional 3.33 |