Immigrants from Denmark vs Central American Indian Average Family Size
COMPARE
Immigrants from Denmark
Central American Indian
Average Family Size
Average Family Size Comparison
Immigrants from Denmark
Central American Indians
3.15
AVERAGE FAMILY SIZE
0.4/ 100
METRIC RATING
281st/ 347
METRIC RANK
3.35
AVERAGE FAMILY SIZE
100.0/ 100
METRIC RATING
61st/ 347
METRIC RANK
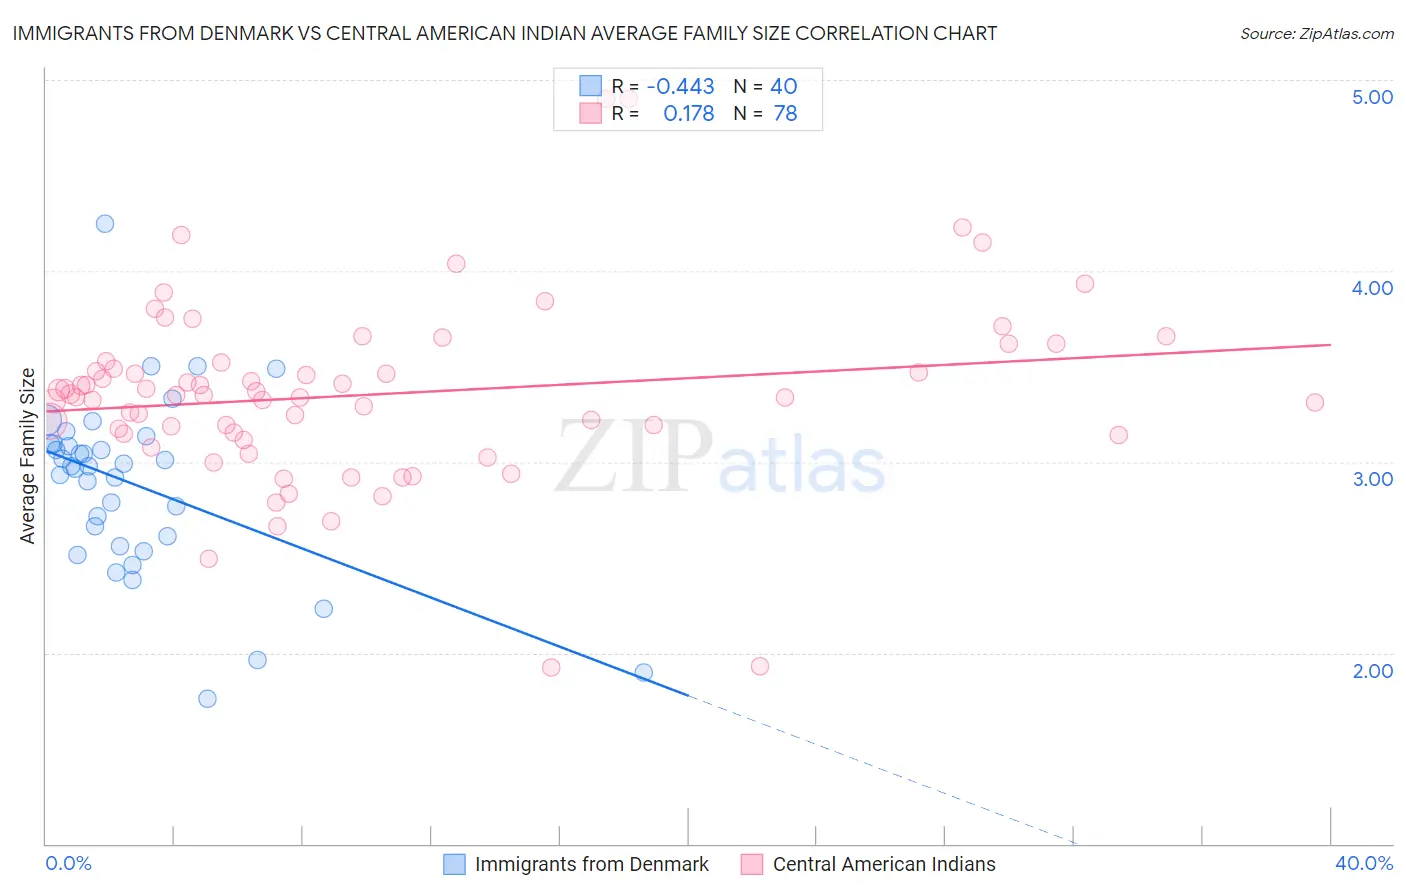
Immigrants from Denmark vs Central American Indian Average Family Size Correlation Chart
The statistical analysis conducted on geographies consisting of 136,403,907 people shows a moderate negative correlation between the proportion of Immigrants from Denmark and average family size in the United States with a correlation coefficient (R) of -0.443 and weighted average of 3.15. Similarly, the statistical analysis conducted on geographies consisting of 326,061,161 people shows a poor positive correlation between the proportion of Central American Indians and average family size in the United States with a correlation coefficient (R) of 0.178 and weighted average of 3.35, a difference of 6.4%.
Average Family Size Correlation Summary
| Measurement | Immigrants from Denmark | Central American Indian |
| Minimum | 1.76 | 1.92 |
| Maximum | 4.25 | 4.90 |
| Range | 2.49 | 2.98 |
| Mean | 2.88 | 3.35 |
| Median | 2.98 | 3.35 |
| Interquartile 25% (IQ1) | 2.58 | 3.15 |
| Interquartile 75% (IQ3) | 3.10 | 3.52 |
| Interquartile Range (IQR) | 0.51 | 0.37 |
| Standard Deviation (Sample) | 0.47 | 0.48 |
| Standard Deviation (Population) | 0.46 | 0.48 |
Similar Demographics by Average Family Size
Demographics Similar to Immigrants from Denmark by Average Family Size
In terms of average family size, the demographic groups most similar to Immigrants from Denmark are Yugoslavian (3.15, a difference of 0.010%), German Russian (3.15, a difference of 0.020%), Immigrants from England (3.15, a difference of 0.040%), Immigrants from France (3.15, a difference of 0.040%), and Immigrants from Europe (3.15, a difference of 0.060%).
| Demographics | Rating | Rank | Average Family Size |
| Immigrants | Belgium | 0.6 /100 | #274 | Tragic 3.15 |
| Cambodians | 0.6 /100 | #275 | Tragic 3.15 |
| Immigrants | Bosnia and Herzegovina | 0.5 /100 | #276 | Tragic 3.15 |
| Swiss | 0.5 /100 | #277 | Tragic 3.15 |
| Okinawans | 0.5 /100 | #278 | Tragic 3.15 |
| Immigrants | Europe | 0.5 /100 | #279 | Tragic 3.15 |
| Immigrants | England | 0.4 /100 | #280 | Tragic 3.15 |
| Immigrants | Denmark | 0.4 /100 | #281 | Tragic 3.15 |
| Yugoslavians | 0.4 /100 | #282 | Tragic 3.15 |
| German Russians | 0.4 /100 | #283 | Tragic 3.15 |
| Immigrants | France | 0.4 /100 | #284 | Tragic 3.15 |
| Whites/Caucasians | 0.3 /100 | #285 | Tragic 3.14 |
| Immigrants | Netherlands | 0.3 /100 | #286 | Tragic 3.14 |
| Greeks | 0.3 /100 | #287 | Tragic 3.14 |
| Immigrants | Czechoslovakia | 0.3 /100 | #288 | Tragic 3.14 |
Demographics Similar to Central American Indians by Average Family Size
In terms of average family size, the demographic groups most similar to Central American Indians are Immigrants from Armenia (3.35, a difference of 0.030%), Japanese (3.35, a difference of 0.050%), Honduran (3.35, a difference of 0.14%), Sri Lankan (3.35, a difference of 0.15%), and Immigrants from Grenada (3.34, a difference of 0.19%).
| Demographics | Rating | Rank | Average Family Size |
| Immigrants | South Eastern Asia | 100.0 /100 | #54 | Exceptional 3.36 |
| Immigrants | Honduras | 100.0 /100 | #55 | Exceptional 3.36 |
| Immigrants | Dominican Republic | 100.0 /100 | #56 | Exceptional 3.35 |
| Sri Lankans | 100.0 /100 | #57 | Exceptional 3.35 |
| Hondurans | 100.0 /100 | #58 | Exceptional 3.35 |
| Japanese | 100.0 /100 | #59 | Exceptional 3.35 |
| Immigrants | Armenia | 100.0 /100 | #60 | Exceptional 3.35 |
| Central American Indians | 100.0 /100 | #61 | Exceptional 3.35 |
| Immigrants | Grenada | 100.0 /100 | #62 | Exceptional 3.34 |
| Chinese | 100.0 /100 | #63 | Exceptional 3.34 |
| Dominicans | 99.9 /100 | #64 | Exceptional 3.34 |
| Immigrants | Laos | 99.9 /100 | #65 | Exceptional 3.34 |
| Immigrants | St. Vincent and the Grenadines | 99.9 /100 | #66 | Exceptional 3.34 |
| Immigrants | Jamaica | 99.9 /100 | #67 | Exceptional 3.33 |
| Immigrants | Cambodia | 99.9 /100 | #68 | Exceptional 3.33 |