Iranian vs Bangladeshi Average Family Size
COMPARE
Iranian
Bangladeshi
Average Family Size
Average Family Size Comparison
Iranians
Bangladeshis
3.18
AVERAGE FAMILY SIZE
4.5/ 100
METRIC RATING
234th/ 347
METRIC RANK
3.37
AVERAGE FAMILY SIZE
100.0/ 100
METRIC RATING
49th/ 347
METRIC RANK
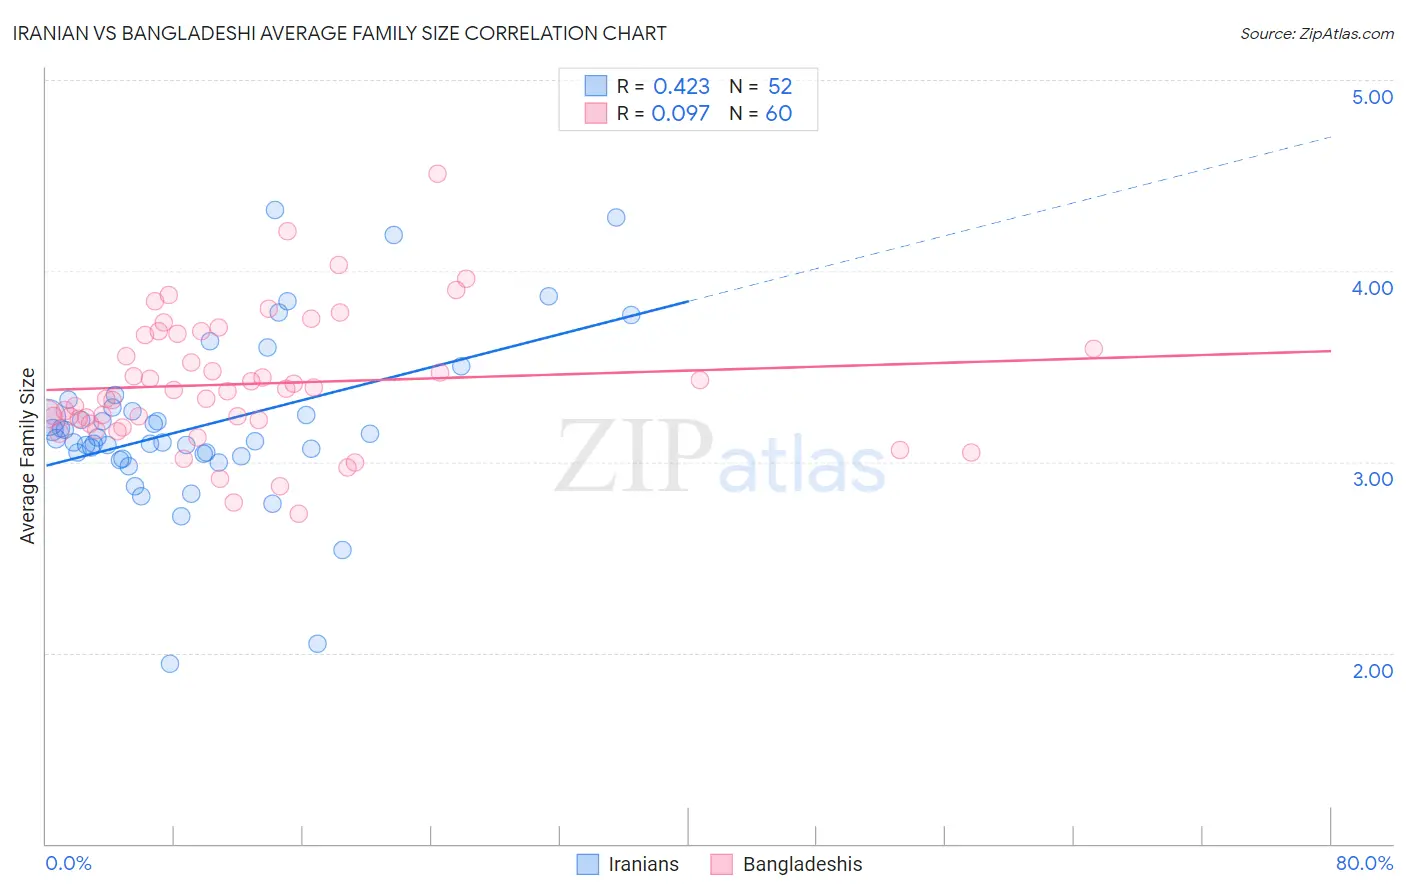
Iranian vs Bangladeshi Average Family Size Correlation Chart
The statistical analysis conducted on geographies consisting of 316,654,945 people shows a moderate positive correlation between the proportion of Iranians and average family size in the United States with a correlation coefficient (R) of 0.423 and weighted average of 3.18. Similarly, the statistical analysis conducted on geographies consisting of 141,330,696 people shows a slight positive correlation between the proportion of Bangladeshis and average family size in the United States with a correlation coefficient (R) of 0.097 and weighted average of 3.37, a difference of 5.8%.
Average Family Size Correlation Summary
| Measurement | Iranian | Bangladeshi |
| Minimum | 1.94 | 2.73 |
| Maximum | 4.32 | 4.51 |
| Range | 2.38 | 1.78 |
| Mean | 3.19 | 3.41 |
| Median | 3.12 | 3.37 |
| Interquartile 25% (IQ1) | 3.04 | 3.21 |
| Interquartile 75% (IQ3) | 3.27 | 3.67 |
| Interquartile Range (IQR) | 0.24 | 0.46 |
| Standard Deviation (Sample) | 0.44 | 0.34 |
| Standard Deviation (Population) | 0.44 | 0.34 |
Similar Demographics by Average Family Size
Demographics Similar to Iranians by Average Family Size
In terms of average family size, the demographic groups most similar to Iranians are Brazilian (3.18, a difference of 0.0%), Immigrants from Turkey (3.18, a difference of 0.020%), Cherokee (3.18, a difference of 0.030%), Immigrants from Portugal (3.18, a difference of 0.030%), and Icelander (3.19, a difference of 0.070%).
| Demographics | Rating | Rank | Average Family Size |
| Portuguese | 6.0 /100 | #227 | Tragic 3.19 |
| Immigrants | Nonimmigrants | 5.7 /100 | #228 | Tragic 3.19 |
| Immigrants | Italy | 5.3 /100 | #229 | Tragic 3.19 |
| Icelanders | 5.2 /100 | #230 | Tragic 3.19 |
| Basques | 5.2 /100 | #231 | Tragic 3.19 |
| Cherokee | 4.7 /100 | #232 | Tragic 3.18 |
| Brazilians | 4.5 /100 | #233 | Tragic 3.18 |
| Iranians | 4.5 /100 | #234 | Tragic 3.18 |
| Immigrants | Turkey | 4.2 /100 | #235 | Tragic 3.18 |
| Immigrants | Portugal | 4.2 /100 | #236 | Tragic 3.18 |
| Immigrants | Romania | 3.7 /100 | #237 | Tragic 3.18 |
| Romanians | 3.7 /100 | #238 | Tragic 3.18 |
| Houma | 3.4 /100 | #239 | Tragic 3.18 |
| Osage | 3.2 /100 | #240 | Tragic 3.18 |
| Immigrants | Japan | 3.0 /100 | #241 | Tragic 3.18 |
Demographics Similar to Bangladeshis by Average Family Size
In terms of average family size, the demographic groups most similar to Bangladeshis are Immigrants from Nicaragua (3.37, a difference of 0.060%), Vietnamese (3.37, a difference of 0.070%), Haitian (3.37, a difference of 0.11%), Immigrants from Bangladesh (3.36, a difference of 0.14%), and Shoshone (3.37, a difference of 0.16%).
| Demographics | Rating | Rank | Average Family Size |
| Immigrants | Vietnam | 100.0 /100 | #42 | Exceptional 3.38 |
| Immigrants | Philippines | 100.0 /100 | #43 | Exceptional 3.37 |
| Alaska Natives | 100.0 /100 | #44 | Exceptional 3.37 |
| Shoshone | 100.0 /100 | #45 | Exceptional 3.37 |
| Haitians | 100.0 /100 | #46 | Exceptional 3.37 |
| Vietnamese | 100.0 /100 | #47 | Exceptional 3.37 |
| Immigrants | Nicaragua | 100.0 /100 | #48 | Exceptional 3.37 |
| Bangladeshis | 100.0 /100 | #49 | Exceptional 3.37 |
| Immigrants | Bangladesh | 100.0 /100 | #50 | Exceptional 3.36 |
| Nicaraguans | 100.0 /100 | #51 | Exceptional 3.36 |
| Fijians | 100.0 /100 | #52 | Exceptional 3.36 |
| Koreans | 100.0 /100 | #53 | Exceptional 3.36 |
| Immigrants | South Eastern Asia | 100.0 /100 | #54 | Exceptional 3.36 |
| Immigrants | Honduras | 100.0 /100 | #55 | Exceptional 3.36 |
| Immigrants | Dominican Republic | 100.0 /100 | #56 | Exceptional 3.35 |