Immigrants from Trinidad and Tobago vs Central American Indian Average Family Size
COMPARE
Immigrants from Trinidad and Tobago
Central American Indian
Average Family Size
Average Family Size Comparison
Immigrants from Trinidad and Tobago
Central American Indians
3.33
AVERAGE FAMILY SIZE
99.9/ 100
METRIC RATING
70th/ 347
METRIC RANK
3.35
AVERAGE FAMILY SIZE
100.0/ 100
METRIC RATING
61st/ 347
METRIC RANK
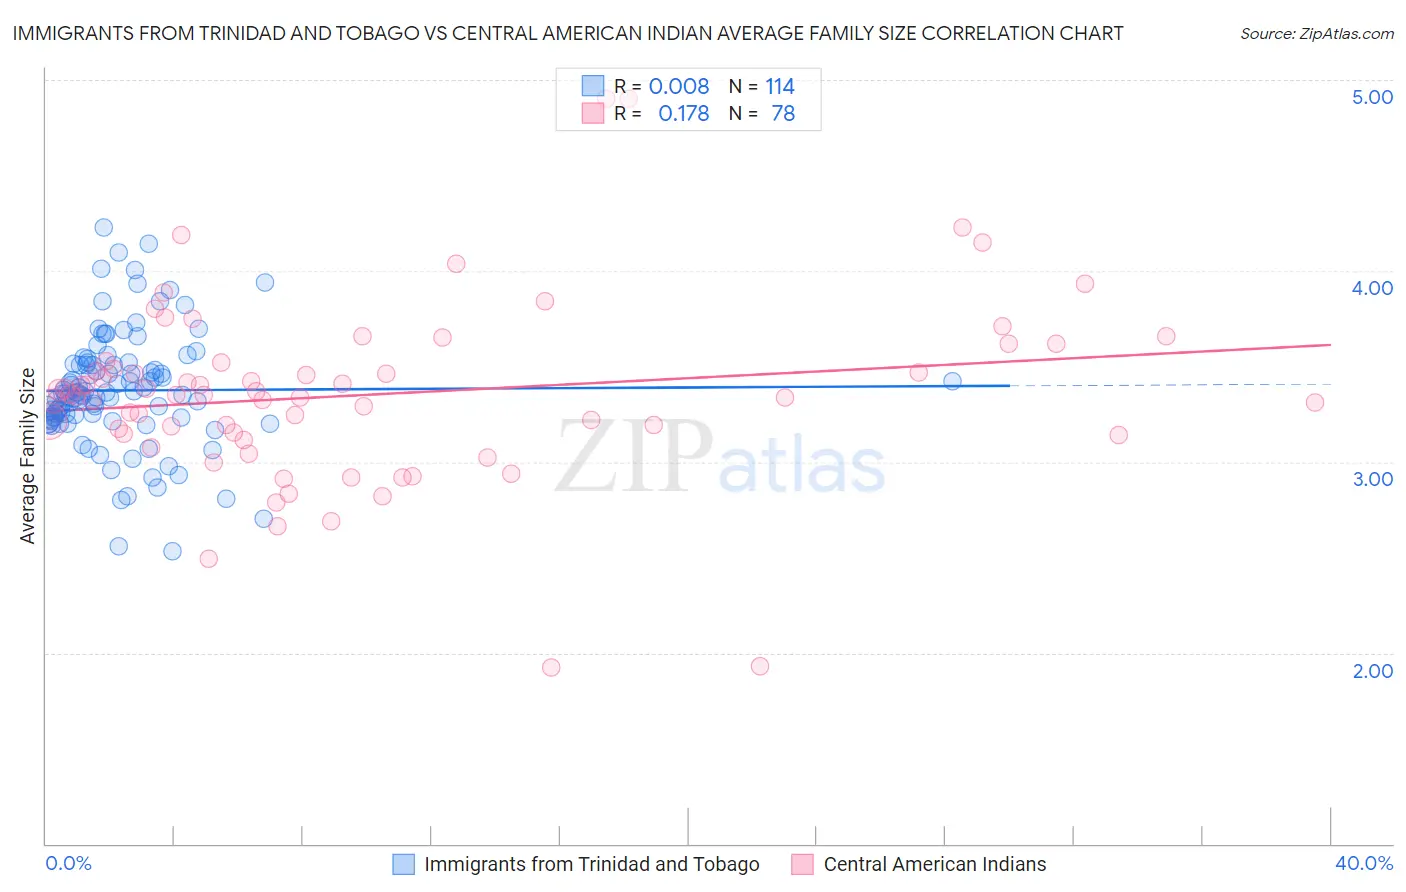
Immigrants from Trinidad and Tobago vs Central American Indian Average Family Size Correlation Chart
The statistical analysis conducted on geographies consisting of 223,484,407 people shows no correlation between the proportion of Immigrants from Trinidad and Tobago and average family size in the United States with a correlation coefficient (R) of 0.008 and weighted average of 3.33. Similarly, the statistical analysis conducted on geographies consisting of 326,061,161 people shows a poor positive correlation between the proportion of Central American Indians and average family size in the United States with a correlation coefficient (R) of 0.178 and weighted average of 3.35, a difference of 0.56%.
Average Family Size Correlation Summary
| Measurement | Immigrants from Trinidad and Tobago | Central American Indian |
| Minimum | 2.53 | 1.92 |
| Maximum | 4.23 | 4.90 |
| Range | 1.70 | 2.98 |
| Mean | 3.37 | 3.35 |
| Median | 3.36 | 3.35 |
| Interquartile 25% (IQ1) | 3.23 | 3.15 |
| Interquartile 75% (IQ3) | 3.51 | 3.52 |
| Interquartile Range (IQR) | 0.28 | 0.37 |
| Standard Deviation (Sample) | 0.30 | 0.48 |
| Standard Deviation (Population) | 0.30 | 0.48 |
Demographics Similar to Immigrants from Trinidad and Tobago and Central American Indians by Average Family Size
In terms of average family size, the demographic groups most similar to Immigrants from Trinidad and Tobago are Immigrants from West Indies (3.33, a difference of 0.010%), Immigrants (3.33, a difference of 0.050%), Immigrants from Cambodia (3.33, a difference of 0.080%), Immigrants from Caribbean (3.33, a difference of 0.080%), and Yaqui (3.32, a difference of 0.11%). Similarly, the demographic groups most similar to Central American Indians are Immigrants from Armenia (3.35, a difference of 0.030%), Japanese (3.35, a difference of 0.050%), Honduran (3.35, a difference of 0.14%), Sri Lankan (3.35, a difference of 0.15%), and Immigrants from Grenada (3.34, a difference of 0.19%).
| Demographics | Rating | Rank | Average Family Size |
| Immigrants | Honduras | 100.0 /100 | #55 | Exceptional 3.36 |
| Immigrants | Dominican Republic | 100.0 /100 | #56 | Exceptional 3.35 |
| Sri Lankans | 100.0 /100 | #57 | Exceptional 3.35 |
| Hondurans | 100.0 /100 | #58 | Exceptional 3.35 |
| Japanese | 100.0 /100 | #59 | Exceptional 3.35 |
| Immigrants | Armenia | 100.0 /100 | #60 | Exceptional 3.35 |
| Central American Indians | 100.0 /100 | #61 | Exceptional 3.35 |
| Immigrants | Grenada | 100.0 /100 | #62 | Exceptional 3.34 |
| Chinese | 100.0 /100 | #63 | Exceptional 3.34 |
| Dominicans | 99.9 /100 | #64 | Exceptional 3.34 |
| Immigrants | Laos | 99.9 /100 | #65 | Exceptional 3.34 |
| Immigrants | St. Vincent and the Grenadines | 99.9 /100 | #66 | Exceptional 3.34 |
| Immigrants | Jamaica | 99.9 /100 | #67 | Exceptional 3.33 |
| Immigrants | Cambodia | 99.9 /100 | #68 | Exceptional 3.33 |
| Immigrants | Immigrants | 99.9 /100 | #69 | Exceptional 3.33 |
| Immigrants | Trinidad and Tobago | 99.9 /100 | #70 | Exceptional 3.33 |
| Immigrants | West Indies | 99.9 /100 | #71 | Exceptional 3.33 |
| Immigrants | Caribbean | 99.9 /100 | #72 | Exceptional 3.33 |
| Yaqui | 99.9 /100 | #73 | Exceptional 3.32 |
| Immigrants | Sierra Leone | 99.9 /100 | #74 | Exceptional 3.32 |
| Immigrants | Barbados | 99.8 /100 | #75 | Exceptional 3.32 |