Iranian vs Central American Indian College, Under 1 year
COMPARE
Iranian
Central American Indian
College, Under 1 year
College, Under 1 year Comparison
Iranians
Central American Indians
74.9%
COLLEGE, UNDER 1 YEAR
100.0/ 100
METRIC RATING
2nd/ 347
METRIC RANK
59.0%
COLLEGE, UNDER 1 YEAR
0.0/ 100
METRIC RATING
296th/ 347
METRIC RANK
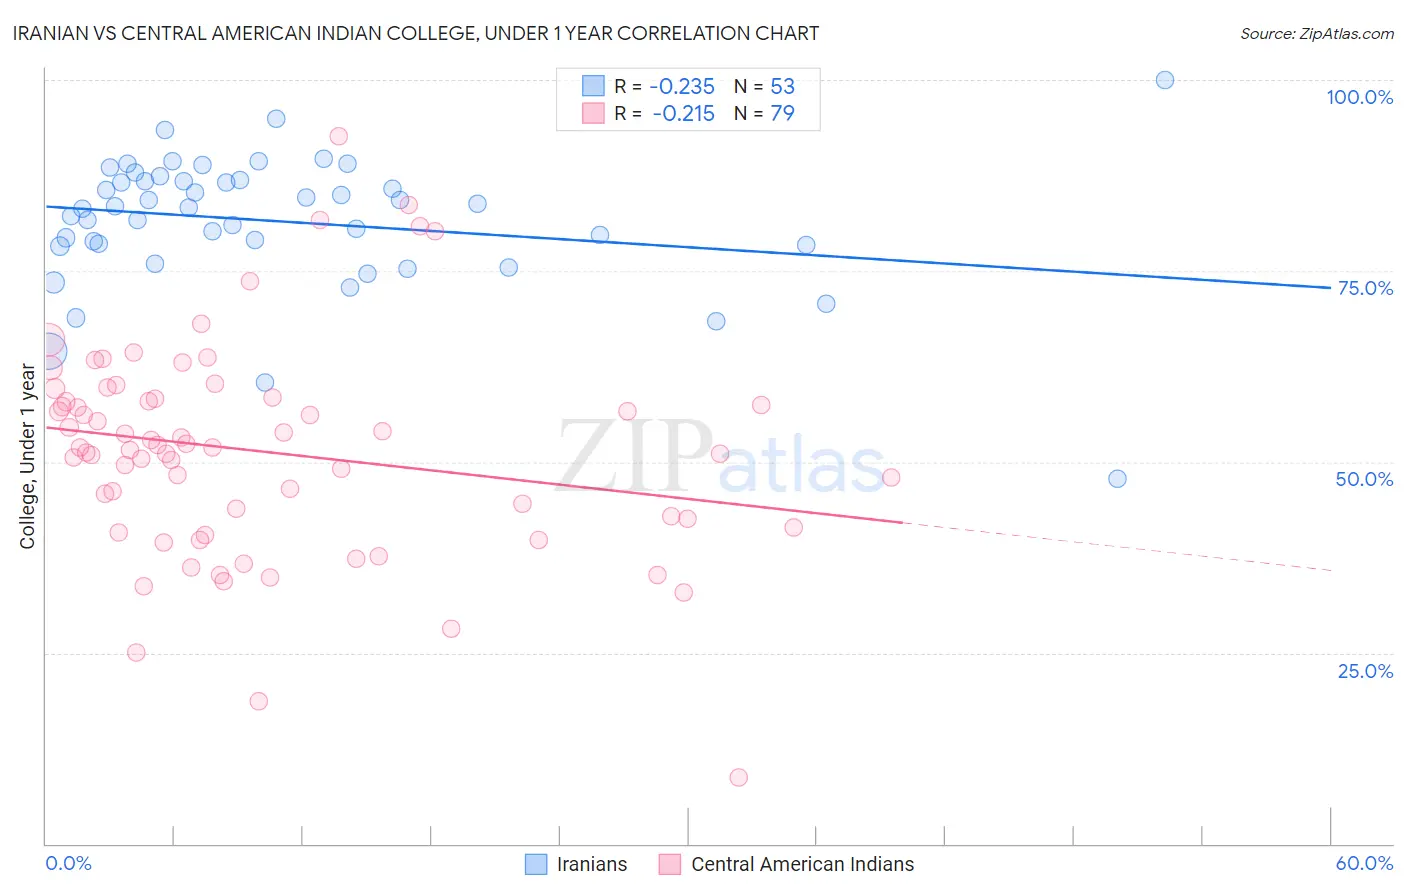
Iranian vs Central American Indian College, Under 1 year Correlation Chart
The statistical analysis conducted on geographies consisting of 316,900,663 people shows a weak negative correlation between the proportion of Iranians and percentage of population with at least college, under 1 year education in the United States with a correlation coefficient (R) of -0.235 and weighted average of 74.9%. Similarly, the statistical analysis conducted on geographies consisting of 326,142,761 people shows a weak negative correlation between the proportion of Central American Indians and percentage of population with at least college, under 1 year education in the United States with a correlation coefficient (R) of -0.215 and weighted average of 59.0%, a difference of 26.8%.
College, Under 1 year Correlation Summary
| Measurement | Iranian | Central American Indian |
| Minimum | 47.7% | 8.7% |
| Maximum | 100.0% | 92.6% |
| Range | 52.3% | 83.9% |
| Mean | 81.5% | 51.3% |
| Median | 83.3% | 51.8% |
| Interquartile 25% (IQ1) | 78.4% | 41.5% |
| Interquartile 75% (IQ3) | 86.9% | 58.2% |
| Interquartile Range (IQR) | 8.5% | 16.8% |
| Standard Deviation (Sample) | 8.8% | 14.2% |
| Standard Deviation (Population) | 8.8% | 14.1% |
Similar Demographics by College, Under 1 year
Demographics Similar to Iranians by College, Under 1 year
In terms of college, under 1 year, the demographic groups most similar to Iranians are Immigrants from Singapore (74.8%, a difference of 0.050%), Immigrants from India (74.4%, a difference of 0.56%), Immigrants from Iran (74.3%, a difference of 0.79%), Filipino (75.5%, a difference of 0.85%), and Immigrants from Taiwan (74.2%, a difference of 0.90%).
| Demographics | Rating | Rank | College, Under 1 year |
| Filipinos | 100.0 /100 | #1 | Exceptional 75.5% |
| Iranians | 100.0 /100 | #2 | Exceptional 74.9% |
| Immigrants | Singapore | 100.0 /100 | #3 | Exceptional 74.8% |
| Immigrants | India | 100.0 /100 | #4 | Exceptional 74.4% |
| Immigrants | Iran | 100.0 /100 | #5 | Exceptional 74.3% |
| Immigrants | Taiwan | 100.0 /100 | #6 | Exceptional 74.2% |
| Okinawans | 100.0 /100 | #7 | Exceptional 73.7% |
| Thais | 100.0 /100 | #8 | Exceptional 73.4% |
| Immigrants | Australia | 100.0 /100 | #9 | Exceptional 72.7% |
| Immigrants | Israel | 100.0 /100 | #10 | Exceptional 72.3% |
| Immigrants | South Central Asia | 100.0 /100 | #11 | Exceptional 72.1% |
| Immigrants | Sweden | 100.0 /100 | #12 | Exceptional 72.1% |
| Cypriots | 100.0 /100 | #13 | Exceptional 72.0% |
| Cambodians | 100.0 /100 | #14 | Exceptional 71.9% |
| Burmese | 100.0 /100 | #15 | Exceptional 71.9% |
Demographics Similar to Central American Indians by College, Under 1 year
In terms of college, under 1 year, the demographic groups most similar to Central American Indians are Immigrants from Grenada (59.1%, a difference of 0.040%), Guyanese (59.0%, a difference of 0.040%), Immigrants from Belize (59.1%, a difference of 0.14%), Seminole (59.1%, a difference of 0.16%), and Nicaraguan (59.2%, a difference of 0.35%).
| Demographics | Rating | Rank | College, Under 1 year |
| Choctaw | 0.0 /100 | #289 | Tragic 59.3% |
| Ecuadorians | 0.0 /100 | #290 | Tragic 59.3% |
| Creek | 0.0 /100 | #291 | Tragic 59.3% |
| Nicaraguans | 0.0 /100 | #292 | Tragic 59.2% |
| Seminole | 0.0 /100 | #293 | Tragic 59.1% |
| Immigrants | Belize | 0.0 /100 | #294 | Tragic 59.1% |
| Immigrants | Grenada | 0.0 /100 | #295 | Tragic 59.1% |
| Central American Indians | 0.0 /100 | #296 | Tragic 59.0% |
| Guyanese | 0.0 /100 | #297 | Tragic 59.0% |
| Immigrants | Ecuador | 0.0 /100 | #298 | Tragic 58.7% |
| Cubans | 0.0 /100 | #299 | Tragic 58.6% |
| Immigrants | Guyana | 0.0 /100 | #300 | Tragic 58.5% |
| Mexican American Indians | 0.0 /100 | #301 | Tragic 58.1% |
| Apache | 0.0 /100 | #302 | Tragic 58.0% |
| Immigrants | Dominica | 0.0 /100 | #303 | Tragic 57.9% |