Iranian vs Central American Indian In Labor Force | Age 25-29
COMPARE
Iranian
Central American Indian
In Labor Force | Age 25-29
In Labor Force | Age 25-29 Comparison
Iranians
Central American Indians
84.8%
IN LABOR FORCE | AGE 25-29
78.1/ 100
METRIC RATING
131st/ 347
METRIC RANK
82.4%
IN LABOR FORCE | AGE 25-29
0.0/ 100
METRIC RATING
308th/ 347
METRIC RANK
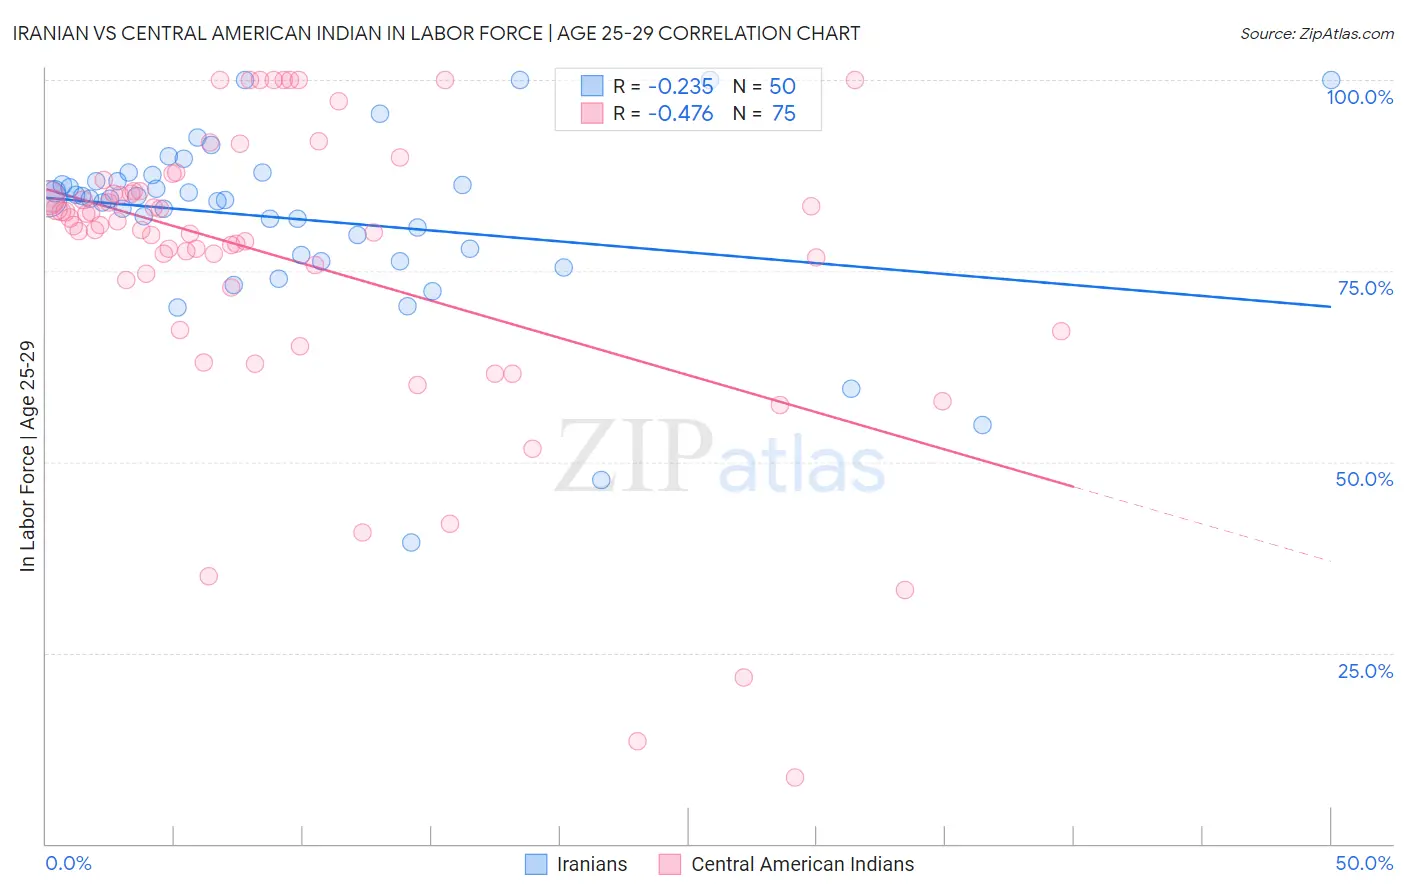
Iranian vs Central American Indian In Labor Force | Age 25-29 Correlation Chart
The statistical analysis conducted on geographies consisting of 316,808,668 people shows a weak negative correlation between the proportion of Iranians and labor force participation rate among population between the ages 25 and 29 in the United States with a correlation coefficient (R) of -0.235 and weighted average of 84.8%. Similarly, the statistical analysis conducted on geographies consisting of 326,098,631 people shows a moderate negative correlation between the proportion of Central American Indians and labor force participation rate among population between the ages 25 and 29 in the United States with a correlation coefficient (R) of -0.476 and weighted average of 82.4%, a difference of 2.9%.
In Labor Force | Age 25-29 Correlation Summary
| Measurement | Iranian | Central American Indian |
| Minimum | 39.4% | 8.6% |
| Maximum | 100.0% | 100.0% |
| Range | 60.6% | 91.4% |
| Mean | 81.8% | 76.3% |
| Median | 84.5% | 80.9% |
| Interquartile 25% (IQ1) | 77.2% | 72.9% |
| Interquartile 75% (IQ3) | 86.7% | 85.4% |
| Interquartile Range (IQR) | 9.6% | 12.5% |
| Standard Deviation (Sample) | 11.9% | 19.5% |
| Standard Deviation (Population) | 11.8% | 19.4% |
Similar Demographics by In Labor Force | Age 25-29
Demographics Similar to Iranians by In Labor Force | Age 25-29
In terms of in labor force | age 25-29, the demographic groups most similar to Iranians are Romanian (84.8%, a difference of 0.0%), Asian (84.8%, a difference of 0.0%), Syrian (84.8%, a difference of 0.020%), Immigrants from Hungary (84.8%, a difference of 0.020%), and Bhutanese (84.8%, a difference of 0.020%).
| Demographics | Rating | Rank | In Labor Force | Age 25-29 |
| Immigrants | Iran | 84.8 /100 | #124 | Excellent 84.9% |
| Uruguayans | 84.7 /100 | #125 | Excellent 84.9% |
| Immigrants | Singapore | 84.4 /100 | #126 | Excellent 84.9% |
| Immigrants | Uruguay | 84.0 /100 | #127 | Excellent 84.9% |
| Australians | 83.6 /100 | #128 | Excellent 84.9% |
| Immigrants | Russia | 81.6 /100 | #129 | Excellent 84.9% |
| Northern Europeans | 81.3 /100 | #130 | Excellent 84.9% |
| Iranians | 78.1 /100 | #131 | Good 84.8% |
| Romanians | 77.7 /100 | #132 | Good 84.8% |
| Asians | 77.7 /100 | #133 | Good 84.8% |
| Syrians | 76.5 /100 | #134 | Good 84.8% |
| Immigrants | Hungary | 76.4 /100 | #135 | Good 84.8% |
| Bhutanese | 76.0 /100 | #136 | Good 84.8% |
| Immigrants | Canada | 73.5 /100 | #137 | Good 84.8% |
| Armenians | 72.7 /100 | #138 | Good 84.8% |
Demographics Similar to Central American Indians by In Labor Force | Age 25-29
In terms of in labor force | age 25-29, the demographic groups most similar to Central American Indians are Immigrants from Central America (82.4%, a difference of 0.010%), Cajun (82.5%, a difference of 0.15%), Osage (82.3%, a difference of 0.15%), Alaskan Athabascan (82.3%, a difference of 0.16%), and Black/African American (82.6%, a difference of 0.21%).
| Demographics | Rating | Rank | In Labor Force | Age 25-29 |
| Vietnamese | 0.0 /100 | #301 | Tragic 82.8% |
| Immigrants | Belize | 0.0 /100 | #302 | Tragic 82.8% |
| Immigrants | Grenada | 0.0 /100 | #303 | Tragic 82.8% |
| Immigrants | St. Vincent and the Grenadines | 0.0 /100 | #304 | Tragic 82.7% |
| Blacks/African Americans | 0.0 /100 | #305 | Tragic 82.6% |
| Blackfeet | 0.0 /100 | #306 | Tragic 82.6% |
| Cajuns | 0.0 /100 | #307 | Tragic 82.5% |
| Central American Indians | 0.0 /100 | #308 | Tragic 82.4% |
| Immigrants | Central America | 0.0 /100 | #309 | Tragic 82.4% |
| Osage | 0.0 /100 | #310 | Tragic 82.3% |
| Alaskan Athabascans | 0.0 /100 | #311 | Tragic 82.3% |
| Hispanics or Latinos | 0.0 /100 | #312 | Tragic 82.2% |
| Yaqui | 0.0 /100 | #313 | Tragic 82.2% |
| Cherokee | 0.0 /100 | #314 | Tragic 82.1% |
| Immigrants | Mexico | 0.0 /100 | #315 | Tragic 82.0% |