Iraqi vs Immigrants from Congo Married-couple Households
COMPARE
Iraqi
Immigrants from Congo
Married-couple Households
Married-couple Households Comparison
Iraqis
Immigrants from Congo
46.9%
MARRIED-COUPLE HOUSEHOLDS
71.7/ 100
METRIC RATING
160th/ 347
METRIC RANK
39.0%
MARRIED-COUPLE HOUSEHOLDS
0.0/ 100
METRIC RATING
331st/ 347
METRIC RANK
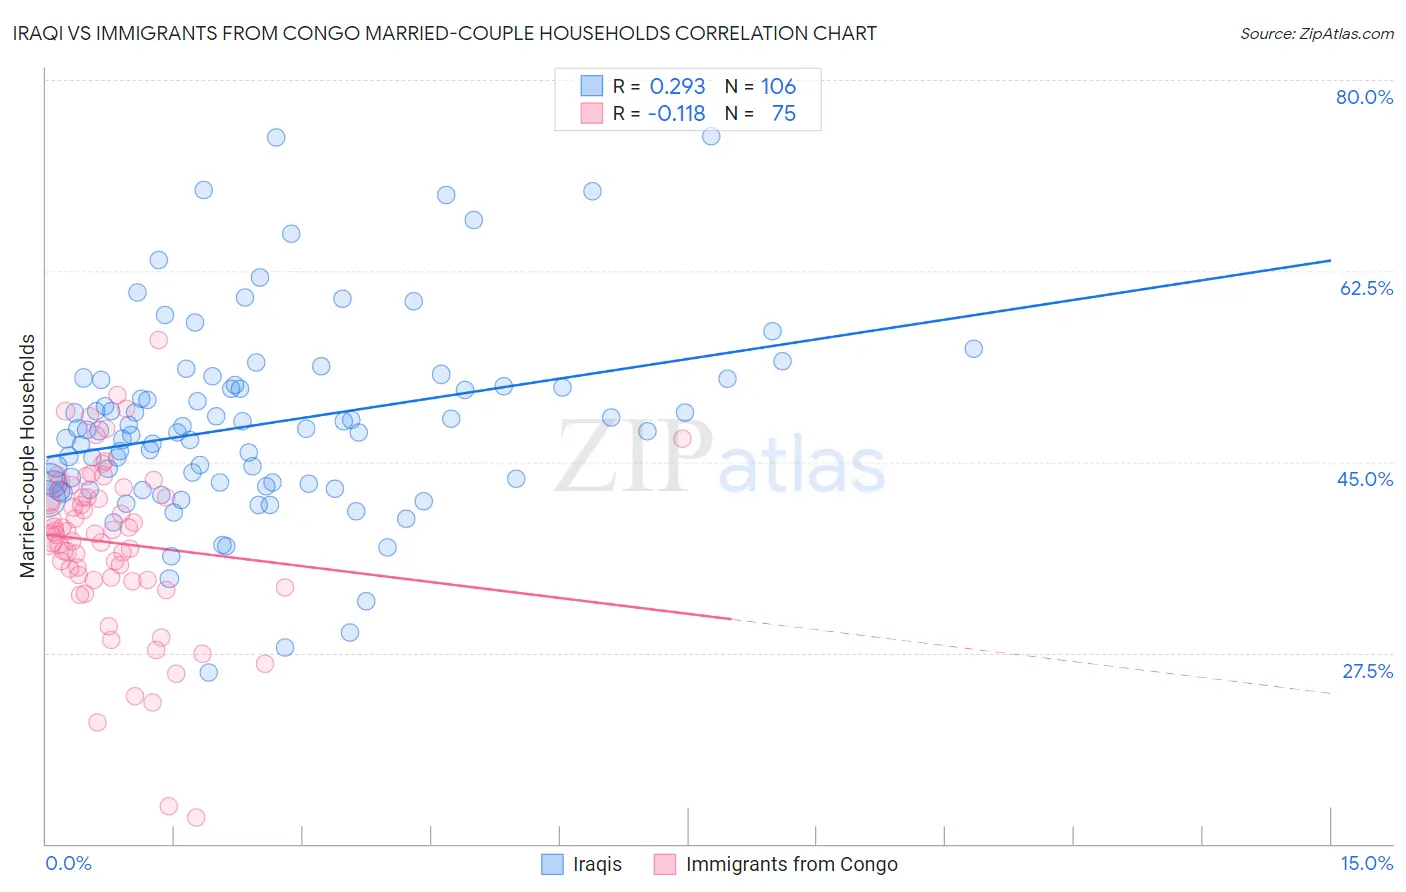
Iraqi vs Immigrants from Congo Married-couple Households Correlation Chart
The statistical analysis conducted on geographies consisting of 170,633,006 people shows a weak positive correlation between the proportion of Iraqis and percentage of married-couple family households in the United States with a correlation coefficient (R) of 0.293 and weighted average of 46.9%. Similarly, the statistical analysis conducted on geographies consisting of 92,079,581 people shows a poor negative correlation between the proportion of Immigrants from Congo and percentage of married-couple family households in the United States with a correlation coefficient (R) of -0.118 and weighted average of 39.0%, a difference of 20.0%.
Married-couple Households Correlation Summary
| Measurement | Iraqi | Immigrants from Congo |
| Minimum | 25.7% | 12.4% |
| Maximum | 74.8% | 56.2% |
| Range | 49.1% | 43.8% |
| Mean | 48.4% | 37.6% |
| Median | 47.9% | 38.4% |
| Interquartile 25% (IQ1) | 43.0% | 34.2% |
| Interquartile 75% (IQ3) | 52.0% | 41.7% |
| Interquartile Range (IQR) | 9.1% | 7.5% |
| Standard Deviation (Sample) | 9.0% | 7.8% |
| Standard Deviation (Population) | 8.9% | 7.8% |
Similar Demographics by Married-couple Households
Demographics Similar to Iraqis by Married-couple Households
In terms of married-couple households, the demographic groups most similar to Iraqis are Delaware (46.8%, a difference of 0.020%), Colombian (46.8%, a difference of 0.030%), Nonimmigrants (46.9%, a difference of 0.070%), Osage (46.9%, a difference of 0.070%), and Immigrants from Turkey (46.8%, a difference of 0.070%).
| Demographics | Rating | Rank | Married-couple Households |
| Hmong | 76.2 /100 | #153 | Good 47.0% |
| Immigrants | Western Asia | 76.1 /100 | #154 | Good 46.9% |
| Arabs | 76.0 /100 | #155 | Good 46.9% |
| Armenians | 75.4 /100 | #156 | Good 46.9% |
| Immigrants | Oceania | 74.8 /100 | #157 | Good 46.9% |
| Immigrants | Nonimmigrants | 73.3 /100 | #158 | Good 46.9% |
| Osage | 73.2 /100 | #159 | Good 46.9% |
| Iraqis | 71.7 /100 | #160 | Good 46.9% |
| Delaware | 71.2 /100 | #161 | Good 46.8% |
| Colombians | 71.0 /100 | #162 | Good 46.8% |
| Immigrants | Turkey | 70.2 /100 | #163 | Good 46.8% |
| Immigrants | Kazakhstan | 70.0 /100 | #164 | Good 46.8% |
| Immigrants | Southern Europe | 69.9 /100 | #165 | Good 46.8% |
| Cherokee | 65.7 /100 | #166 | Good 46.7% |
| Immigrants | Croatia | 64.2 /100 | #167 | Good 46.7% |
Demographics Similar to Immigrants from Congo by Married-couple Households
In terms of married-couple households, the demographic groups most similar to Immigrants from Congo are Somali (39.0%, a difference of 0.090%), Immigrants from West Indies (39.0%, a difference of 0.12%), Immigrants from Barbados (39.2%, a difference of 0.44%), Immigrants from Dominica (39.4%, a difference of 0.88%), and Immigrants from St. Vincent and the Grenadines (38.7%, a difference of 0.90%).
| Demographics | Rating | Rank | Married-couple Households |
| Navajo | 0.0 /100 | #324 | Tragic 40.1% |
| Pueblo | 0.0 /100 | #325 | Tragic 40.0% |
| U.S. Virgin Islanders | 0.0 /100 | #326 | Tragic 39.8% |
| Lumbee | 0.0 /100 | #327 | Tragic 39.6% |
| Barbadians | 0.0 /100 | #328 | Tragic 39.4% |
| Immigrants | Dominica | 0.0 /100 | #329 | Tragic 39.4% |
| Immigrants | Barbados | 0.0 /100 | #330 | Tragic 39.2% |
| Immigrants | Congo | 0.0 /100 | #331 | Tragic 39.0% |
| Somalis | 0.0 /100 | #332 | Tragic 39.0% |
| Immigrants | West Indies | 0.0 /100 | #333 | Tragic 39.0% |
| Immigrants | St. Vincent and the Grenadines | 0.0 /100 | #334 | Tragic 38.7% |
| Senegalese | 0.0 /100 | #335 | Tragic 38.6% |
| Blacks/African Americans | 0.0 /100 | #336 | Tragic 38.5% |
| Immigrants | Somalia | 0.0 /100 | #337 | Tragic 38.4% |
| Immigrants | Senegal | 0.0 /100 | #338 | Tragic 38.4% |