Immigrants from Vietnam vs Immigrants from Congo Married-couple Households
COMPARE
Immigrants from Vietnam
Immigrants from Congo
Married-couple Households
Married-couple Households Comparison
Immigrants from Vietnam
Immigrants from Congo
48.8%
MARRIED-COUPLE HOUSEHOLDS
99.6/ 100
METRIC RATING
42nd/ 347
METRIC RANK
39.0%
MARRIED-COUPLE HOUSEHOLDS
0.0/ 100
METRIC RATING
331st/ 347
METRIC RANK
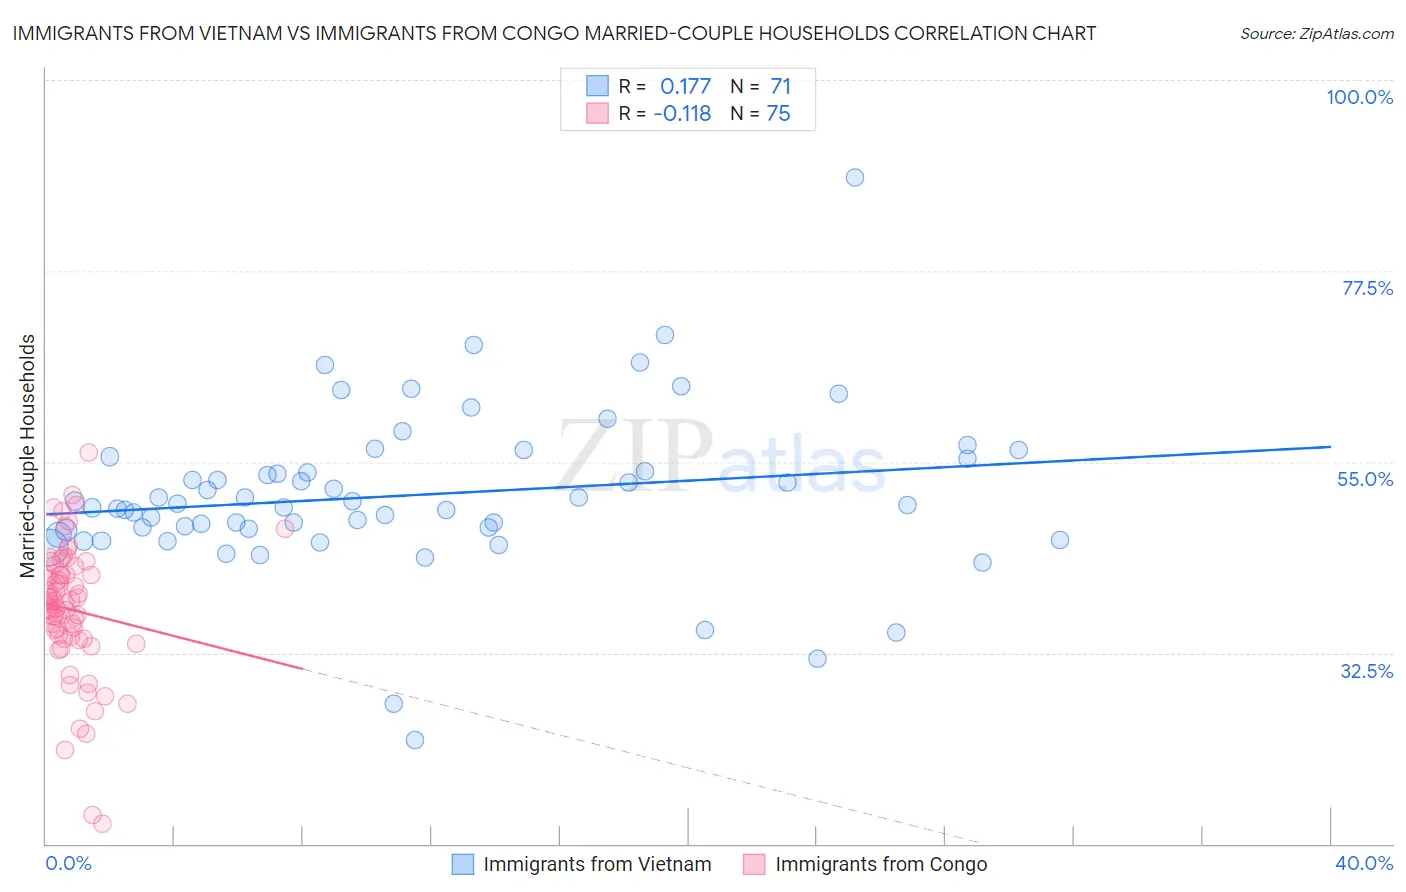
Immigrants from Vietnam vs Immigrants from Congo Married-couple Households Correlation Chart
The statistical analysis conducted on geographies consisting of 404,551,130 people shows a poor positive correlation between the proportion of Immigrants from Vietnam and percentage of married-couple family households in the United States with a correlation coefficient (R) of 0.177 and weighted average of 48.8%. Similarly, the statistical analysis conducted on geographies consisting of 92,079,581 people shows a poor negative correlation between the proportion of Immigrants from Congo and percentage of married-couple family households in the United States with a correlation coefficient (R) of -0.118 and weighted average of 39.0%, a difference of 25.1%.
Married-couple Households Correlation Summary
| Measurement | Immigrants from Vietnam | Immigrants from Congo |
| Minimum | 22.2% | 12.4% |
| Maximum | 88.5% | 56.2% |
| Range | 66.2% | 43.8% |
| Mean | 51.1% | 37.6% |
| Median | 49.9% | 38.4% |
| Interquartile 25% (IQ1) | 47.0% | 34.2% |
| Interquartile 75% (IQ3) | 55.3% | 41.7% |
| Interquartile Range (IQR) | 8.3% | 7.5% |
| Standard Deviation (Sample) | 9.7% | 7.8% |
| Standard Deviation (Population) | 9.6% | 7.8% |
Similar Demographics by Married-couple Households
Demographics Similar to Immigrants from Vietnam by Married-couple Households
In terms of married-couple households, the demographic groups most similar to Immigrants from Vietnam are Immigrants from Lebanon (48.9%, a difference of 0.050%), Immigrants from Iran (48.8%, a difference of 0.060%), Immigrants from Bolivia (48.9%, a difference of 0.080%), Lithuanian (48.9%, a difference of 0.090%), and Welsh (48.8%, a difference of 0.10%).
| Demographics | Rating | Rank | Married-couple Households |
| Scottish | 99.7 /100 | #35 | Exceptional 49.0% |
| Iranians | 99.7 /100 | #36 | Exceptional 49.0% |
| Sri Lankans | 99.7 /100 | #37 | Exceptional 49.0% |
| Greeks | 99.7 /100 | #38 | Exceptional 48.9% |
| Lithuanians | 99.6 /100 | #39 | Exceptional 48.9% |
| Immigrants | Bolivia | 99.6 /100 | #40 | Exceptional 48.9% |
| Immigrants | Lebanon | 99.6 /100 | #41 | Exceptional 48.9% |
| Immigrants | Vietnam | 99.6 /100 | #42 | Exceptional 48.8% |
| Immigrants | Iran | 99.6 /100 | #43 | Exceptional 48.8% |
| Welsh | 99.5 /100 | #44 | Exceptional 48.8% |
| Immigrants | Eastern Asia | 99.5 /100 | #45 | Exceptional 48.8% |
| Tsimshian | 99.5 /100 | #46 | Exceptional 48.7% |
| British | 99.5 /100 | #47 | Exceptional 48.7% |
| Indians (Asian) | 99.4 /100 | #48 | Exceptional 48.7% |
| Immigrants | Sri Lanka | 99.4 /100 | #49 | Exceptional 48.7% |
Demographics Similar to Immigrants from Congo by Married-couple Households
In terms of married-couple households, the demographic groups most similar to Immigrants from Congo are Somali (39.0%, a difference of 0.090%), Immigrants from West Indies (39.0%, a difference of 0.12%), Immigrants from Barbados (39.2%, a difference of 0.44%), Immigrants from Dominica (39.4%, a difference of 0.88%), and Immigrants from St. Vincent and the Grenadines (38.7%, a difference of 0.90%).
| Demographics | Rating | Rank | Married-couple Households |
| Navajo | 0.0 /100 | #324 | Tragic 40.1% |
| Pueblo | 0.0 /100 | #325 | Tragic 40.0% |
| U.S. Virgin Islanders | 0.0 /100 | #326 | Tragic 39.8% |
| Lumbee | 0.0 /100 | #327 | Tragic 39.6% |
| Barbadians | 0.0 /100 | #328 | Tragic 39.4% |
| Immigrants | Dominica | 0.0 /100 | #329 | Tragic 39.4% |
| Immigrants | Barbados | 0.0 /100 | #330 | Tragic 39.2% |
| Immigrants | Congo | 0.0 /100 | #331 | Tragic 39.0% |
| Somalis | 0.0 /100 | #332 | Tragic 39.0% |
| Immigrants | West Indies | 0.0 /100 | #333 | Tragic 39.0% |
| Immigrants | St. Vincent and the Grenadines | 0.0 /100 | #334 | Tragic 38.7% |
| Senegalese | 0.0 /100 | #335 | Tragic 38.6% |
| Blacks/African Americans | 0.0 /100 | #336 | Tragic 38.5% |
| Immigrants | Somalia | 0.0 /100 | #337 | Tragic 38.4% |
| Immigrants | Senegal | 0.0 /100 | #338 | Tragic 38.4% |