Carpatho Rusyn vs Immigrants from Congo Married-couple Households
COMPARE
Carpatho Rusyn
Immigrants from Congo
Married-couple Households
Married-couple Households Comparison
Carpatho Rusyns
Immigrants from Congo
45.7%
MARRIED-COUPLE HOUSEHOLDS
15.7/ 100
METRIC RATING
199th/ 347
METRIC RANK
39.0%
MARRIED-COUPLE HOUSEHOLDS
0.0/ 100
METRIC RATING
331st/ 347
METRIC RANK
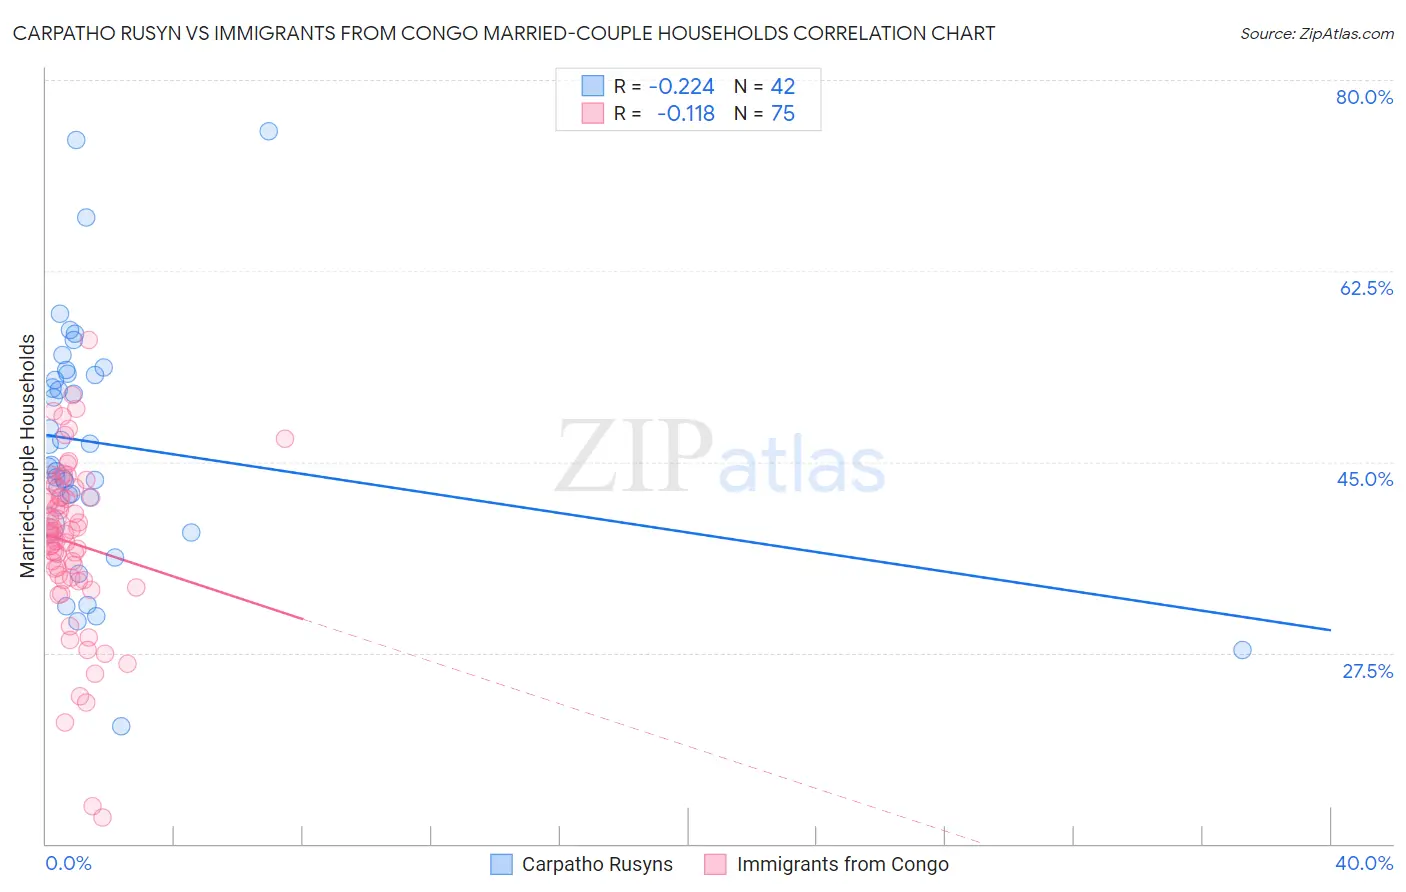
Carpatho Rusyn vs Immigrants from Congo Married-couple Households Correlation Chart
The statistical analysis conducted on geographies consisting of 58,871,690 people shows a weak negative correlation between the proportion of Carpatho Rusyns and percentage of married-couple family households in the United States with a correlation coefficient (R) of -0.224 and weighted average of 45.7%. Similarly, the statistical analysis conducted on geographies consisting of 92,079,581 people shows a poor negative correlation between the proportion of Immigrants from Congo and percentage of married-couple family households in the United States with a correlation coefficient (R) of -0.118 and weighted average of 39.0%, a difference of 17.1%.
Married-couple Households Correlation Summary
| Measurement | Carpatho Rusyn | Immigrants from Congo |
| Minimum | 20.8% | 12.4% |
| Maximum | 75.4% | 56.2% |
| Range | 54.6% | 43.8% |
| Mean | 46.6% | 37.6% |
| Median | 45.7% | 38.4% |
| Interquartile 25% (IQ1) | 41.8% | 34.2% |
| Interquartile 75% (IQ3) | 53.1% | 41.7% |
| Interquartile Range (IQR) | 11.3% | 7.5% |
| Standard Deviation (Sample) | 11.4% | 7.8% |
| Standard Deviation (Population) | 11.3% | 7.8% |
Similar Demographics by Married-couple Households
Demographics Similar to Carpatho Rusyns by Married-couple Households
In terms of married-couple households, the demographic groups most similar to Carpatho Rusyns are Potawatomi (45.7%, a difference of 0.010%), Immigrants from Serbia (45.7%, a difference of 0.040%), Immigrants from Central America (45.7%, a difference of 0.12%), Alaska Native (45.6%, a difference of 0.21%), and Ottawa (45.8%, a difference of 0.24%).
| Demographics | Rating | Rank | Married-couple Households |
| Immigrants | Northern Africa | 24.6 /100 | #192 | Fair 46.0% |
| Taiwanese | 23.4 /100 | #193 | Fair 45.9% |
| Mexican American Indians | 23.3 /100 | #194 | Fair 45.9% |
| Chickasaw | 22.7 /100 | #195 | Fair 45.9% |
| Immigrants | South America | 22.2 /100 | #196 | Fair 45.9% |
| Cambodians | 21.3 /100 | #197 | Fair 45.9% |
| Ottawa | 19.4 /100 | #198 | Poor 45.8% |
| Carpatho Rusyns | 15.7 /100 | #199 | Poor 45.7% |
| Potawatomi | 15.6 /100 | #200 | Poor 45.7% |
| Immigrants | Serbia | 15.2 /100 | #201 | Poor 45.7% |
| Immigrants | Central America | 14.2 /100 | #202 | Poor 45.7% |
| Alaska Natives | 13.0 /100 | #203 | Poor 45.6% |
| Aleuts | 12.5 /100 | #204 | Poor 45.6% |
| Nepalese | 11.9 /100 | #205 | Poor 45.6% |
| Uruguayans | 10.4 /100 | #206 | Poor 45.5% |
Demographics Similar to Immigrants from Congo by Married-couple Households
In terms of married-couple households, the demographic groups most similar to Immigrants from Congo are Somali (39.0%, a difference of 0.090%), Immigrants from West Indies (39.0%, a difference of 0.12%), Immigrants from Barbados (39.2%, a difference of 0.44%), Immigrants from Dominica (39.4%, a difference of 0.88%), and Immigrants from St. Vincent and the Grenadines (38.7%, a difference of 0.90%).
| Demographics | Rating | Rank | Married-couple Households |
| Navajo | 0.0 /100 | #324 | Tragic 40.1% |
| Pueblo | 0.0 /100 | #325 | Tragic 40.0% |
| U.S. Virgin Islanders | 0.0 /100 | #326 | Tragic 39.8% |
| Lumbee | 0.0 /100 | #327 | Tragic 39.6% |
| Barbadians | 0.0 /100 | #328 | Tragic 39.4% |
| Immigrants | Dominica | 0.0 /100 | #329 | Tragic 39.4% |
| Immigrants | Barbados | 0.0 /100 | #330 | Tragic 39.2% |
| Immigrants | Congo | 0.0 /100 | #331 | Tragic 39.0% |
| Somalis | 0.0 /100 | #332 | Tragic 39.0% |
| Immigrants | West Indies | 0.0 /100 | #333 | Tragic 39.0% |
| Immigrants | St. Vincent and the Grenadines | 0.0 /100 | #334 | Tragic 38.7% |
| Senegalese | 0.0 /100 | #335 | Tragic 38.6% |
| Blacks/African Americans | 0.0 /100 | #336 | Tragic 38.5% |
| Immigrants | Somalia | 0.0 /100 | #337 | Tragic 38.4% |
| Immigrants | Senegal | 0.0 /100 | #338 | Tragic 38.4% |