Immigrants from Uganda vs Central American Family Households
COMPARE
Immigrants from Uganda
Central American
Family Households
Family Households Comparison
Immigrants from Uganda
Central Americans
62.7%
FAMILY HOUSEHOLDS
0.1/ 100
METRIC RATING
288th/ 347
METRIC RANK
66.0%
FAMILY HOUSEHOLDS
100.0/ 100
METRIC RATING
62nd/ 347
METRIC RANK
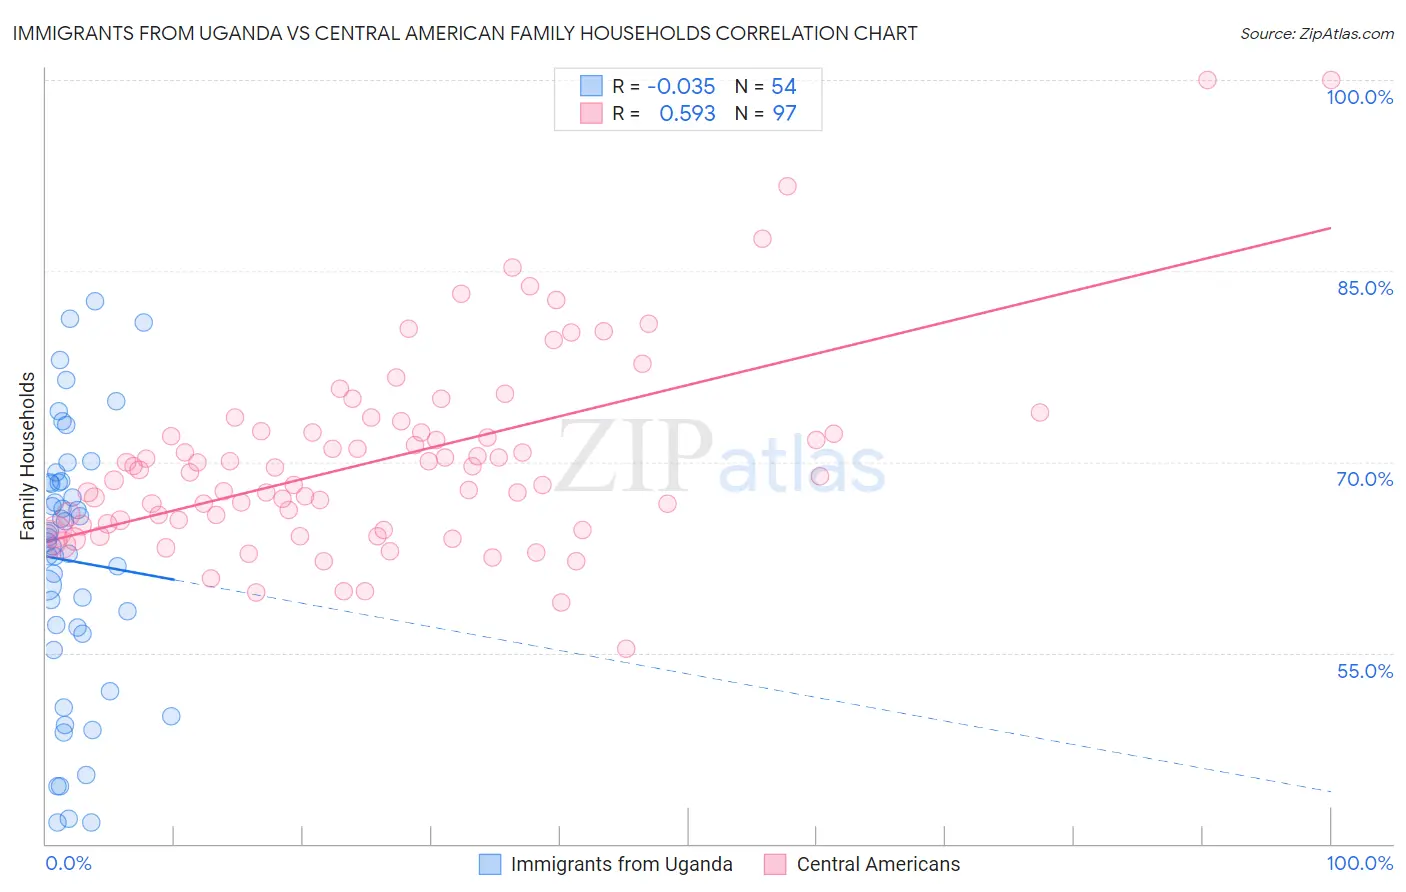
Immigrants from Uganda vs Central American Family Households Correlation Chart
The statistical analysis conducted on geographies consisting of 125,974,849 people shows no correlation between the proportion of Immigrants from Uganda and percentage of family households in the United States with a correlation coefficient (R) of -0.035 and weighted average of 62.7%. Similarly, the statistical analysis conducted on geographies consisting of 504,084,166 people shows a substantial positive correlation between the proportion of Central Americans and percentage of family households in the United States with a correlation coefficient (R) of 0.593 and weighted average of 66.0%, a difference of 5.2%.
Family Households Correlation Summary
| Measurement | Immigrants from Uganda | Central American |
| Minimum | 41.7% | 55.3% |
| Maximum | 82.6% | 100.0% |
| Range | 40.9% | 44.7% |
| Mean | 62.2% | 70.2% |
| Median | 63.9% | 69.2% |
| Interquartile 25% (IQ1) | 56.5% | 65.1% |
| Interquartile 75% (IQ3) | 68.3% | 72.4% |
| Interquartile Range (IQR) | 11.9% | 7.3% |
| Standard Deviation (Sample) | 10.5% | 7.8% |
| Standard Deviation (Population) | 10.4% | 7.8% |
Similar Demographics by Family Households
Demographics Similar to Immigrants from Uganda by Family Households
In terms of family households, the demographic groups most similar to Immigrants from Uganda are British West Indian (62.8%, a difference of 0.020%), Latvian (62.8%, a difference of 0.020%), Mongolian (62.8%, a difference of 0.050%), Immigrants from Nepal (62.7%, a difference of 0.090%), and Australian (62.8%, a difference of 0.16%).
| Demographics | Rating | Rank | Family Households |
| Estonians | 0.2 /100 | #281 | Tragic 62.9% |
| New Zealanders | 0.1 /100 | #282 | Tragic 62.9% |
| Immigrants | Denmark | 0.1 /100 | #283 | Tragic 62.9% |
| Australians | 0.1 /100 | #284 | Tragic 62.8% |
| Mongolians | 0.1 /100 | #285 | Tragic 62.8% |
| British West Indians | 0.1 /100 | #286 | Tragic 62.8% |
| Latvians | 0.1 /100 | #287 | Tragic 62.8% |
| Immigrants | Uganda | 0.1 /100 | #288 | Tragic 62.7% |
| Immigrants | Nepal | 0.1 /100 | #289 | Tragic 62.7% |
| Immigrants | Grenada | 0.0 /100 | #290 | Tragic 62.6% |
| U.S. Virgin Islanders | 0.0 /100 | #291 | Tragic 62.6% |
| Immigrants | Burma/Myanmar | 0.0 /100 | #292 | Tragic 62.6% |
| Immigrants | Sweden | 0.0 /100 | #293 | Tragic 62.5% |
| Barbadians | 0.0 /100 | #294 | Tragic 62.5% |
| Okinawans | 0.0 /100 | #295 | Tragic 62.5% |
Demographics Similar to Central Americans by Family Households
In terms of family households, the demographic groups most similar to Central Americans are Danish (66.0%, a difference of 0.030%), Immigrants from Indonesia (66.0%, a difference of 0.040%), South American (66.0%, a difference of 0.050%), Immigrants from Korea (66.0%, a difference of 0.060%), and Immigrants from Asia (66.1%, a difference of 0.080%).
| Demographics | Rating | Rank | Family Households |
| Immigrants | Immigrants | 100.0 /100 | #55 | Exceptional 66.1% |
| Immigrants | Hong Kong | 100.0 /100 | #56 | Exceptional 66.1% |
| Pennsylvania Germans | 100.0 /100 | #57 | Exceptional 66.1% |
| Immigrants | Asia | 100.0 /100 | #58 | Exceptional 66.1% |
| Immigrants | Korea | 100.0 /100 | #59 | Exceptional 66.0% |
| South Americans | 100.0 /100 | #60 | Exceptional 66.0% |
| Danes | 100.0 /100 | #61 | Exceptional 66.0% |
| Central Americans | 100.0 /100 | #62 | Exceptional 66.0% |
| Immigrants | Indonesia | 100.0 /100 | #63 | Exceptional 66.0% |
| Pima | 99.9 /100 | #64 | Exceptional 65.9% |
| Costa Ricans | 99.9 /100 | #65 | Exceptional 65.9% |
| Fijians | 99.9 /100 | #66 | Exceptional 65.9% |
| Filipinos | 99.9 /100 | #67 | Exceptional 65.9% |
| Japanese | 99.9 /100 | #68 | Exceptional 65.9% |
| Malaysians | 99.9 /100 | #69 | Exceptional 65.9% |