Immigrants from Uganda vs Pakistani Family Households
COMPARE
Immigrants from Uganda
Pakistani
Family Households
Family Households Comparison
Immigrants from Uganda
Pakistanis
62.7%
FAMILY HOUSEHOLDS
0.1/ 100
METRIC RATING
288th/ 347
METRIC RANK
64.7%
FAMILY HOUSEHOLDS
84.0/ 100
METRIC RATING
142nd/ 347
METRIC RANK
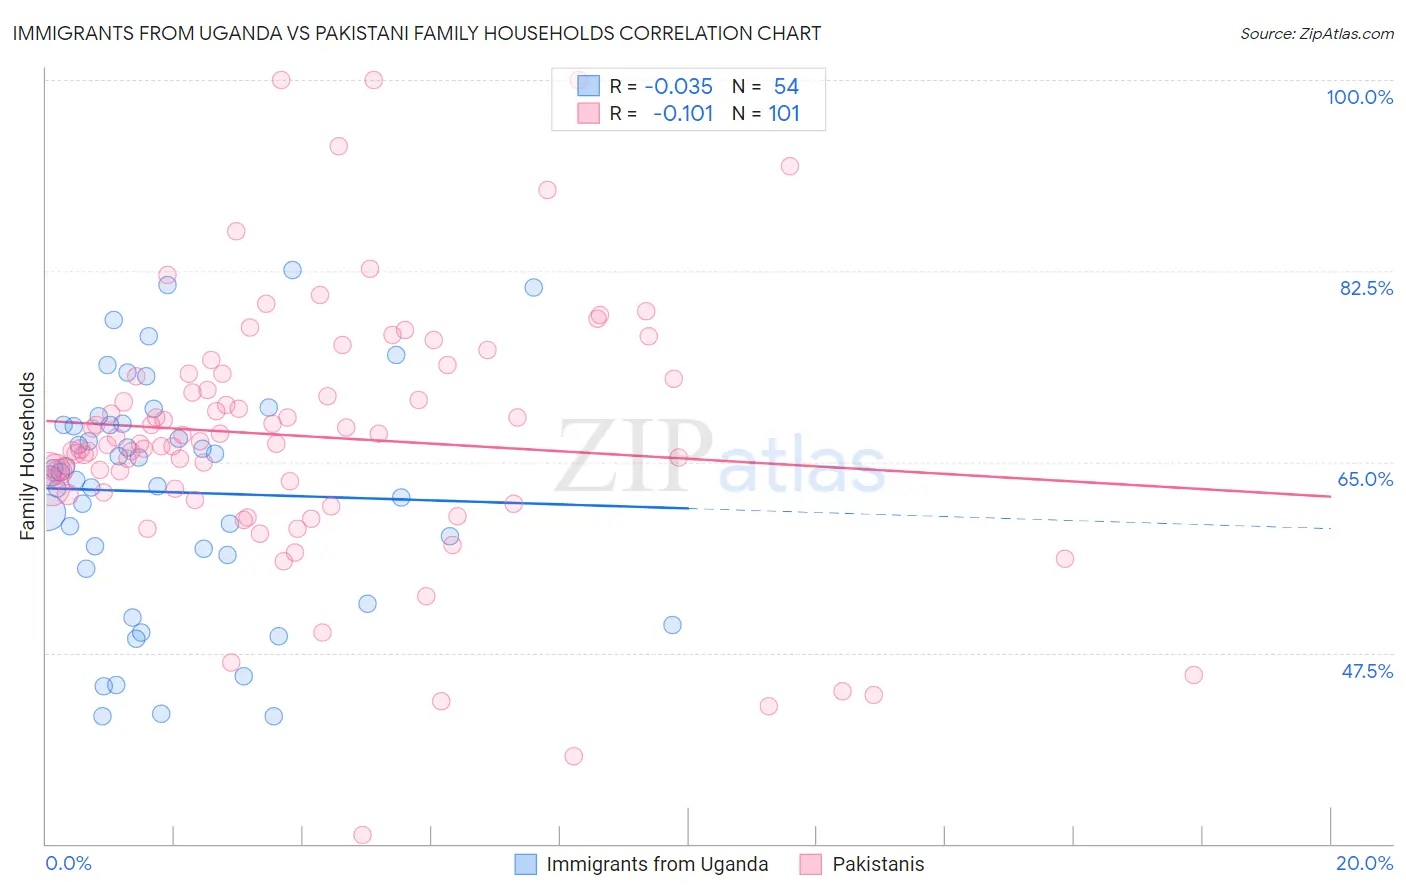
Immigrants from Uganda vs Pakistani Family Households Correlation Chart
The statistical analysis conducted on geographies consisting of 125,974,849 people shows no correlation between the proportion of Immigrants from Uganda and percentage of family households in the United States with a correlation coefficient (R) of -0.035 and weighted average of 62.7%. Similarly, the statistical analysis conducted on geographies consisting of 335,180,363 people shows a poor negative correlation between the proportion of Pakistanis and percentage of family households in the United States with a correlation coefficient (R) of -0.101 and weighted average of 64.7%, a difference of 3.0%.
Family Households Correlation Summary
| Measurement | Immigrants from Uganda | Pakistani |
| Minimum | 41.7% | 30.8% |
| Maximum | 82.6% | 100.0% |
| Range | 40.9% | 69.2% |
| Mean | 62.2% | 67.3% |
| Median | 63.9% | 66.7% |
| Interquartile 25% (IQ1) | 56.5% | 62.1% |
| Interquartile 75% (IQ3) | 68.3% | 73.0% |
| Interquartile Range (IQR) | 11.9% | 10.9% |
| Standard Deviation (Sample) | 10.5% | 12.1% |
| Standard Deviation (Population) | 10.4% | 12.0% |
Similar Demographics by Family Households
Demographics Similar to Immigrants from Uganda by Family Households
In terms of family households, the demographic groups most similar to Immigrants from Uganda are British West Indian (62.8%, a difference of 0.020%), Latvian (62.8%, a difference of 0.020%), Mongolian (62.8%, a difference of 0.050%), Immigrants from Nepal (62.7%, a difference of 0.090%), and Australian (62.8%, a difference of 0.16%).
| Demographics | Rating | Rank | Family Households |
| Estonians | 0.2 /100 | #281 | Tragic 62.9% |
| New Zealanders | 0.1 /100 | #282 | Tragic 62.9% |
| Immigrants | Denmark | 0.1 /100 | #283 | Tragic 62.9% |
| Australians | 0.1 /100 | #284 | Tragic 62.8% |
| Mongolians | 0.1 /100 | #285 | Tragic 62.8% |
| British West Indians | 0.1 /100 | #286 | Tragic 62.8% |
| Latvians | 0.1 /100 | #287 | Tragic 62.8% |
| Immigrants | Uganda | 0.1 /100 | #288 | Tragic 62.7% |
| Immigrants | Nepal | 0.1 /100 | #289 | Tragic 62.7% |
| Immigrants | Grenada | 0.0 /100 | #290 | Tragic 62.6% |
| U.S. Virgin Islanders | 0.0 /100 | #291 | Tragic 62.6% |
| Immigrants | Burma/Myanmar | 0.0 /100 | #292 | Tragic 62.6% |
| Immigrants | Sweden | 0.0 /100 | #293 | Tragic 62.5% |
| Barbadians | 0.0 /100 | #294 | Tragic 62.5% |
| Okinawans | 0.0 /100 | #295 | Tragic 62.5% |
Demographics Similar to Pakistanis by Family Households
In terms of family households, the demographic groups most similar to Pakistanis are Immigrants from North Macedonia (64.7%, a difference of 0.020%), Immigrants from Cameroon (64.7%, a difference of 0.020%), Immigrants from Jamaica (64.7%, a difference of 0.030%), Basque (64.7%, a difference of 0.040%), and Czechoslovakian (64.6%, a difference of 0.050%).
| Demographics | Rating | Rank | Family Households |
| Maltese | 87.4 /100 | #135 | Excellent 64.7% |
| Immigrants | China | 86.6 /100 | #136 | Excellent 64.7% |
| Immigrants | Scotland | 86.4 /100 | #137 | Excellent 64.7% |
| Basques | 85.5 /100 | #138 | Excellent 64.7% |
| Immigrants | Jamaica | 85.3 /100 | #139 | Excellent 64.7% |
| Immigrants | North Macedonia | 84.9 /100 | #140 | Excellent 64.7% |
| Immigrants | Cameroon | 84.8 /100 | #141 | Excellent 64.7% |
| Pakistanis | 84.0 /100 | #142 | Excellent 64.7% |
| Czechoslovakians | 82.1 /100 | #143 | Excellent 64.6% |
| South American Indians | 81.9 /100 | #144 | Excellent 64.6% |
| Welsh | 80.1 /100 | #145 | Excellent 64.6% |
| Immigrants | Romania | 77.0 /100 | #146 | Good 64.6% |
| Immigrants | Chile | 76.5 /100 | #147 | Good 64.6% |
| Delaware | 76.3 /100 | #148 | Good 64.6% |
| Sioux | 76.3 /100 | #149 | Good 64.6% |