Spanish American vs Central American Family Households
COMPARE
Spanish American
Central American
Family Households
Family Households Comparison
Spanish Americans
Central Americans
64.1%
FAMILY HOUSEHOLDS
30.1/ 100
METRIC RATING
186th/ 347
METRIC RANK
66.0%
FAMILY HOUSEHOLDS
100.0/ 100
METRIC RATING
62nd/ 347
METRIC RANK
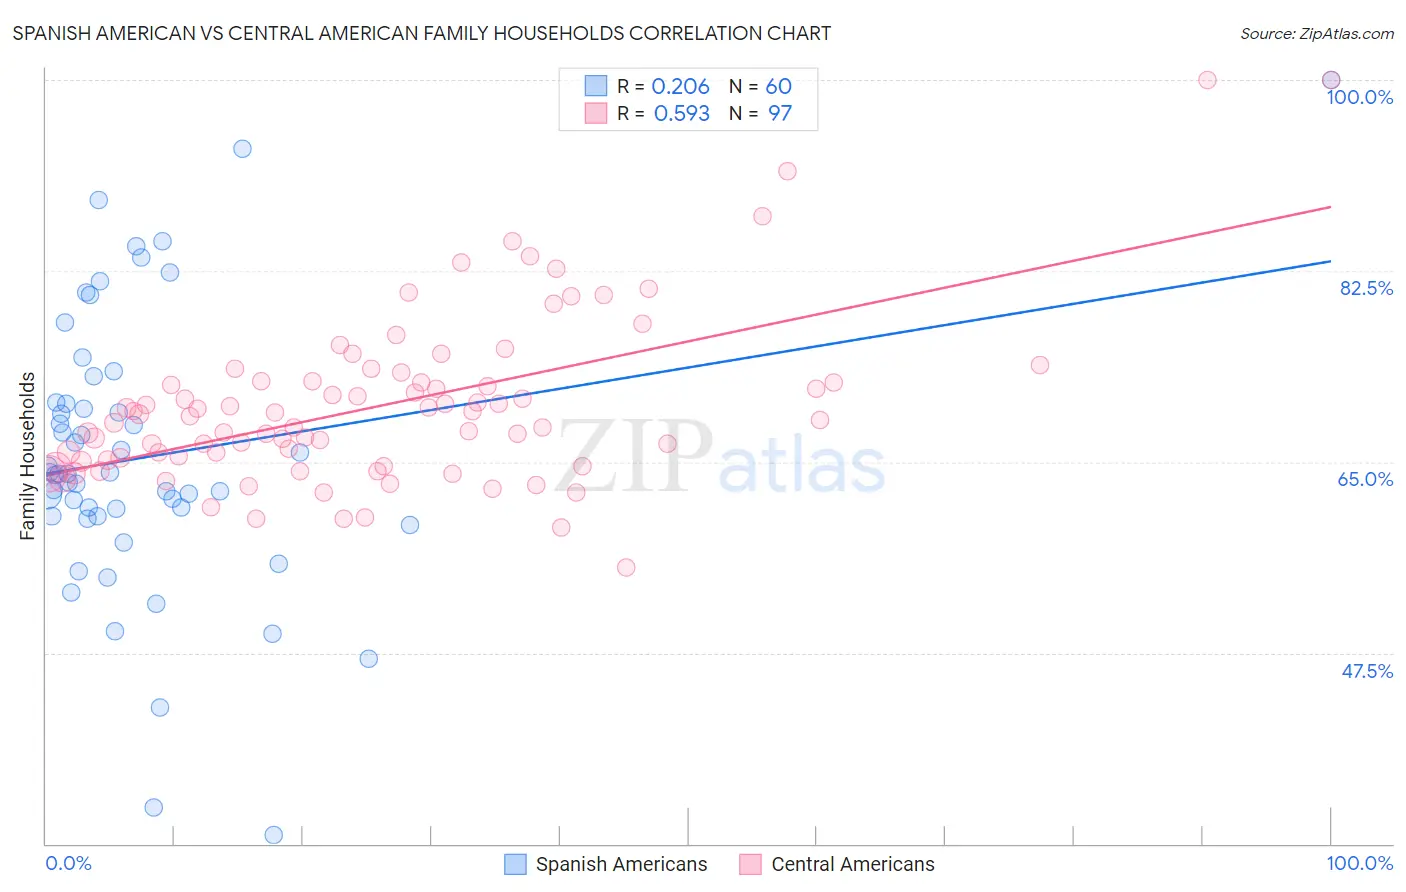
Spanish American vs Central American Family Households Correlation Chart
The statistical analysis conducted on geographies consisting of 103,168,621 people shows a weak positive correlation between the proportion of Spanish Americans and percentage of family households in the United States with a correlation coefficient (R) of 0.206 and weighted average of 64.1%. Similarly, the statistical analysis conducted on geographies consisting of 504,084,166 people shows a substantial positive correlation between the proportion of Central Americans and percentage of family households in the United States with a correlation coefficient (R) of 0.593 and weighted average of 66.0%, a difference of 2.9%.
Family Households Correlation Summary
| Measurement | Spanish American | Central American |
| Minimum | 30.8% | 55.3% |
| Maximum | 100.0% | 100.0% |
| Range | 69.2% | 44.7% |
| Mean | 65.4% | 70.2% |
| Median | 63.9% | 69.2% |
| Interquartile 25% (IQ1) | 60.0% | 65.1% |
| Interquartile 75% (IQ3) | 70.4% | 72.4% |
| Interquartile Range (IQR) | 10.4% | 7.3% |
| Standard Deviation (Sample) | 12.9% | 7.8% |
| Standard Deviation (Population) | 12.8% | 7.8% |
Similar Demographics by Family Households
Demographics Similar to Spanish Americans by Family Households
In terms of family households, the demographic groups most similar to Spanish Americans are Immigrants from Iran (64.1%, a difference of 0.010%), Northern European (64.1%, a difference of 0.030%), Puerto Rican (64.2%, a difference of 0.050%), Creek (64.2%, a difference of 0.060%), and Paraguayan (64.1%, a difference of 0.060%).
| Demographics | Rating | Rank | Family Households |
| Immigrants | Ukraine | 38.2 /100 | #179 | Fair 64.2% |
| Immigrants | Honduras | 35.0 /100 | #180 | Fair 64.2% |
| Immigrants | Trinidad and Tobago | 34.9 /100 | #181 | Fair 64.2% |
| Ukrainians | 34.6 /100 | #182 | Fair 64.2% |
| Creek | 34.1 /100 | #183 | Fair 64.2% |
| Puerto Ricans | 33.4 /100 | #184 | Fair 64.2% |
| Immigrants | Iran | 30.4 /100 | #185 | Fair 64.1% |
| Spanish Americans | 30.1 /100 | #186 | Fair 64.1% |
| Northern Europeans | 28.2 /100 | #187 | Fair 64.1% |
| Paraguayans | 26.7 /100 | #188 | Fair 64.1% |
| Immigrants | Western Asia | 25.3 /100 | #189 | Fair 64.1% |
| Zimbabweans | 24.7 /100 | #190 | Fair 64.1% |
| Arabs | 24.5 /100 | #191 | Fair 64.1% |
| Lithuanians | 23.8 /100 | #192 | Fair 64.0% |
| French | 23.7 /100 | #193 | Fair 64.0% |
Demographics Similar to Central Americans by Family Households
In terms of family households, the demographic groups most similar to Central Americans are Danish (66.0%, a difference of 0.030%), Immigrants from Indonesia (66.0%, a difference of 0.040%), South American (66.0%, a difference of 0.050%), Immigrants from Korea (66.0%, a difference of 0.060%), and Immigrants from Asia (66.1%, a difference of 0.080%).
| Demographics | Rating | Rank | Family Households |
| Immigrants | Immigrants | 100.0 /100 | #55 | Exceptional 66.1% |
| Immigrants | Hong Kong | 100.0 /100 | #56 | Exceptional 66.1% |
| Pennsylvania Germans | 100.0 /100 | #57 | Exceptional 66.1% |
| Immigrants | Asia | 100.0 /100 | #58 | Exceptional 66.1% |
| Immigrants | Korea | 100.0 /100 | #59 | Exceptional 66.0% |
| South Americans | 100.0 /100 | #60 | Exceptional 66.0% |
| Danes | 100.0 /100 | #61 | Exceptional 66.0% |
| Central Americans | 100.0 /100 | #62 | Exceptional 66.0% |
| Immigrants | Indonesia | 100.0 /100 | #63 | Exceptional 66.0% |
| Pima | 99.9 /100 | #64 | Exceptional 65.9% |
| Costa Ricans | 99.9 /100 | #65 | Exceptional 65.9% |
| Fijians | 99.9 /100 | #66 | Exceptional 65.9% |
| Filipinos | 99.9 /100 | #67 | Exceptional 65.9% |
| Japanese | 99.9 /100 | #68 | Exceptional 65.9% |
| Malaysians | 99.9 /100 | #69 | Exceptional 65.9% |