Immigrants from Uganda vs Potawatomi Family Households
COMPARE
Immigrants from Uganda
Potawatomi
Family Households
Family Households Comparison
Immigrants from Uganda
Potawatomi
62.7%
FAMILY HOUSEHOLDS
0.1/ 100
METRIC RATING
288th/ 347
METRIC RANK
63.3%
FAMILY HOUSEHOLDS
1.0/ 100
METRIC RATING
255th/ 347
METRIC RANK
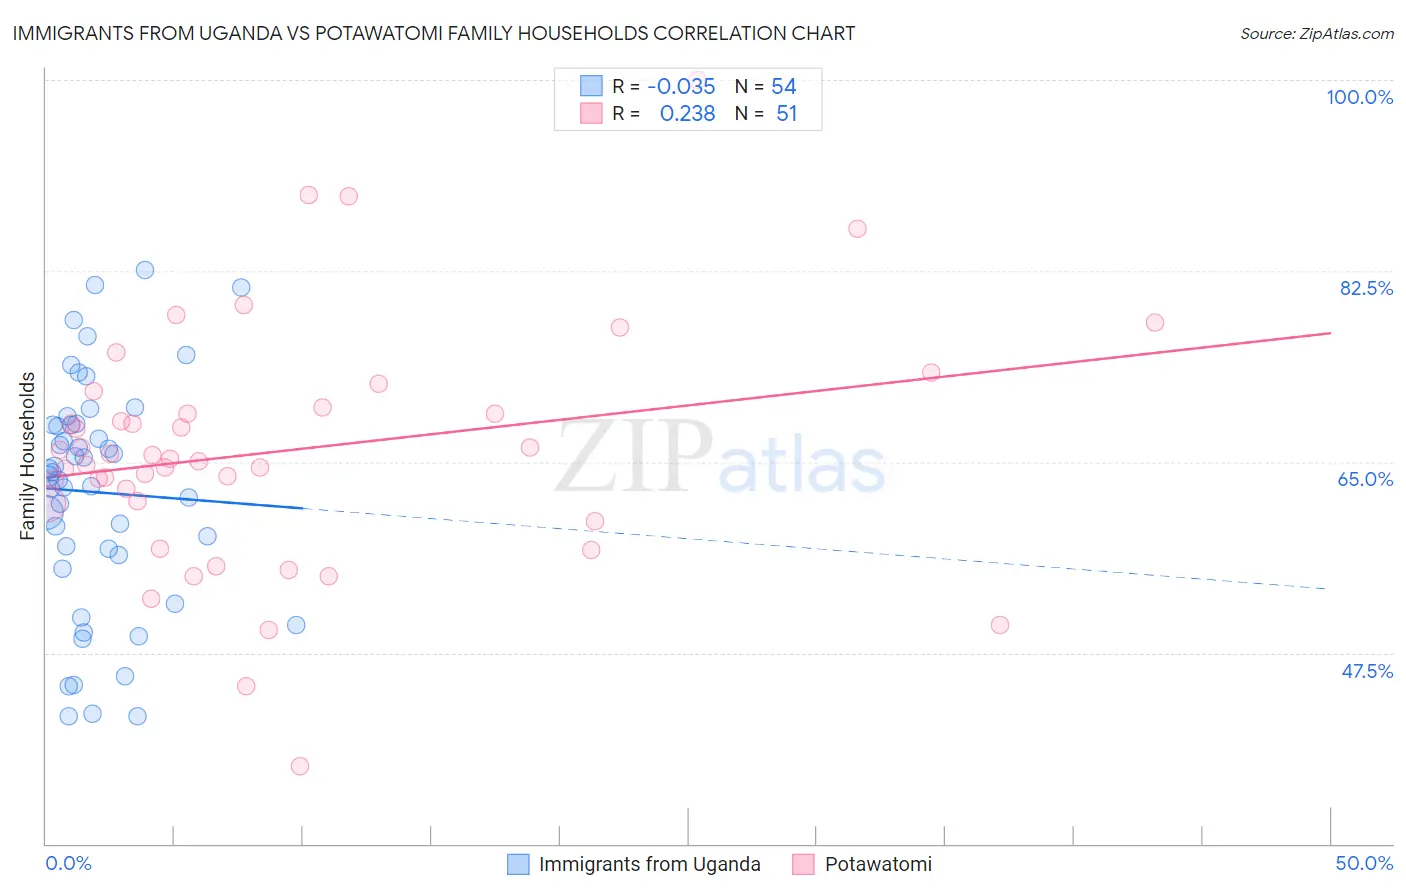
Immigrants from Uganda vs Potawatomi Family Households Correlation Chart
The statistical analysis conducted on geographies consisting of 125,974,849 people shows no correlation between the proportion of Immigrants from Uganda and percentage of family households in the United States with a correlation coefficient (R) of -0.035 and weighted average of 62.7%. Similarly, the statistical analysis conducted on geographies consisting of 117,759,902 people shows a weak positive correlation between the proportion of Potawatomi and percentage of family households in the United States with a correlation coefficient (R) of 0.238 and weighted average of 63.3%, a difference of 0.88%.
Family Households Correlation Summary
| Measurement | Immigrants from Uganda | Potawatomi |
| Minimum | 41.7% | 37.1% |
| Maximum | 82.6% | 100.0% |
| Range | 40.9% | 62.9% |
| Mean | 62.2% | 66.1% |
| Median | 63.9% | 65.3% |
| Interquartile 25% (IQ1) | 56.5% | 61.2% |
| Interquartile 75% (IQ3) | 68.3% | 70.0% |
| Interquartile Range (IQR) | 11.9% | 8.8% |
| Standard Deviation (Sample) | 10.5% | 11.3% |
| Standard Deviation (Population) | 10.4% | 11.2% |
Similar Demographics by Family Households
Demographics Similar to Immigrants from Uganda by Family Households
In terms of family households, the demographic groups most similar to Immigrants from Uganda are British West Indian (62.8%, a difference of 0.020%), Latvian (62.8%, a difference of 0.020%), Mongolian (62.8%, a difference of 0.050%), Immigrants from Nepal (62.7%, a difference of 0.090%), and Australian (62.8%, a difference of 0.16%).
| Demographics | Rating | Rank | Family Households |
| Estonians | 0.2 /100 | #281 | Tragic 62.9% |
| New Zealanders | 0.1 /100 | #282 | Tragic 62.9% |
| Immigrants | Denmark | 0.1 /100 | #283 | Tragic 62.9% |
| Australians | 0.1 /100 | #284 | Tragic 62.8% |
| Mongolians | 0.1 /100 | #285 | Tragic 62.8% |
| British West Indians | 0.1 /100 | #286 | Tragic 62.8% |
| Latvians | 0.1 /100 | #287 | Tragic 62.8% |
| Immigrants | Uganda | 0.1 /100 | #288 | Tragic 62.7% |
| Immigrants | Nepal | 0.1 /100 | #289 | Tragic 62.7% |
| Immigrants | Grenada | 0.0 /100 | #290 | Tragic 62.6% |
| U.S. Virgin Islanders | 0.0 /100 | #291 | Tragic 62.6% |
| Immigrants | Burma/Myanmar | 0.0 /100 | #292 | Tragic 62.6% |
| Immigrants | Sweden | 0.0 /100 | #293 | Tragic 62.5% |
| Barbadians | 0.0 /100 | #294 | Tragic 62.5% |
| Okinawans | 0.0 /100 | #295 | Tragic 62.5% |
Demographics Similar to Potawatomi by Family Households
In terms of family households, the demographic groups most similar to Potawatomi are Slovak (63.3%, a difference of 0.020%), Luxembourger (63.3%, a difference of 0.020%), Immigrants from Dominican Republic (63.3%, a difference of 0.030%), Bahamian (63.3%, a difference of 0.050%), and Icelander (63.3%, a difference of 0.060%).
| Demographics | Rating | Rank | Family Households |
| Dominicans | 1.5 /100 | #248 | Tragic 63.4% |
| Russians | 1.4 /100 | #249 | Tragic 63.4% |
| Immigrants | Japan | 1.4 /100 | #250 | Tragic 63.4% |
| Taiwanese | 1.2 /100 | #251 | Tragic 63.3% |
| Bahamians | 1.1 /100 | #252 | Tragic 63.3% |
| Immigrants | Dominican Republic | 1.0 /100 | #253 | Tragic 63.3% |
| Slovaks | 1.0 /100 | #254 | Tragic 63.3% |
| Potawatomi | 1.0 /100 | #255 | Tragic 63.3% |
| Luxembourgers | 0.9 /100 | #256 | Tragic 63.3% |
| Icelanders | 0.8 /100 | #257 | Tragic 63.3% |
| Immigrants | Barbados | 0.7 /100 | #258 | Tragic 63.2% |
| Immigrants | Western Europe | 0.6 /100 | #259 | Tragic 63.2% |
| Cypriots | 0.6 /100 | #260 | Tragic 63.2% |
| Immigrants | Russia | 0.6 /100 | #261 | Tragic 63.2% |
| Immigrants | Ireland | 0.6 /100 | #262 | Tragic 63.2% |