Immigrants from Uganda vs Central American Poverty
COMPARE
Immigrants from Uganda
Central American
Poverty
Poverty Comparison
Immigrants from Uganda
Central Americans
12.8%
POVERTY
16.5/ 100
METRIC RATING
201st/ 347
METRIC RANK
14.6%
POVERTY
0.1/ 100
METRIC RATING
270th/ 347
METRIC RANK
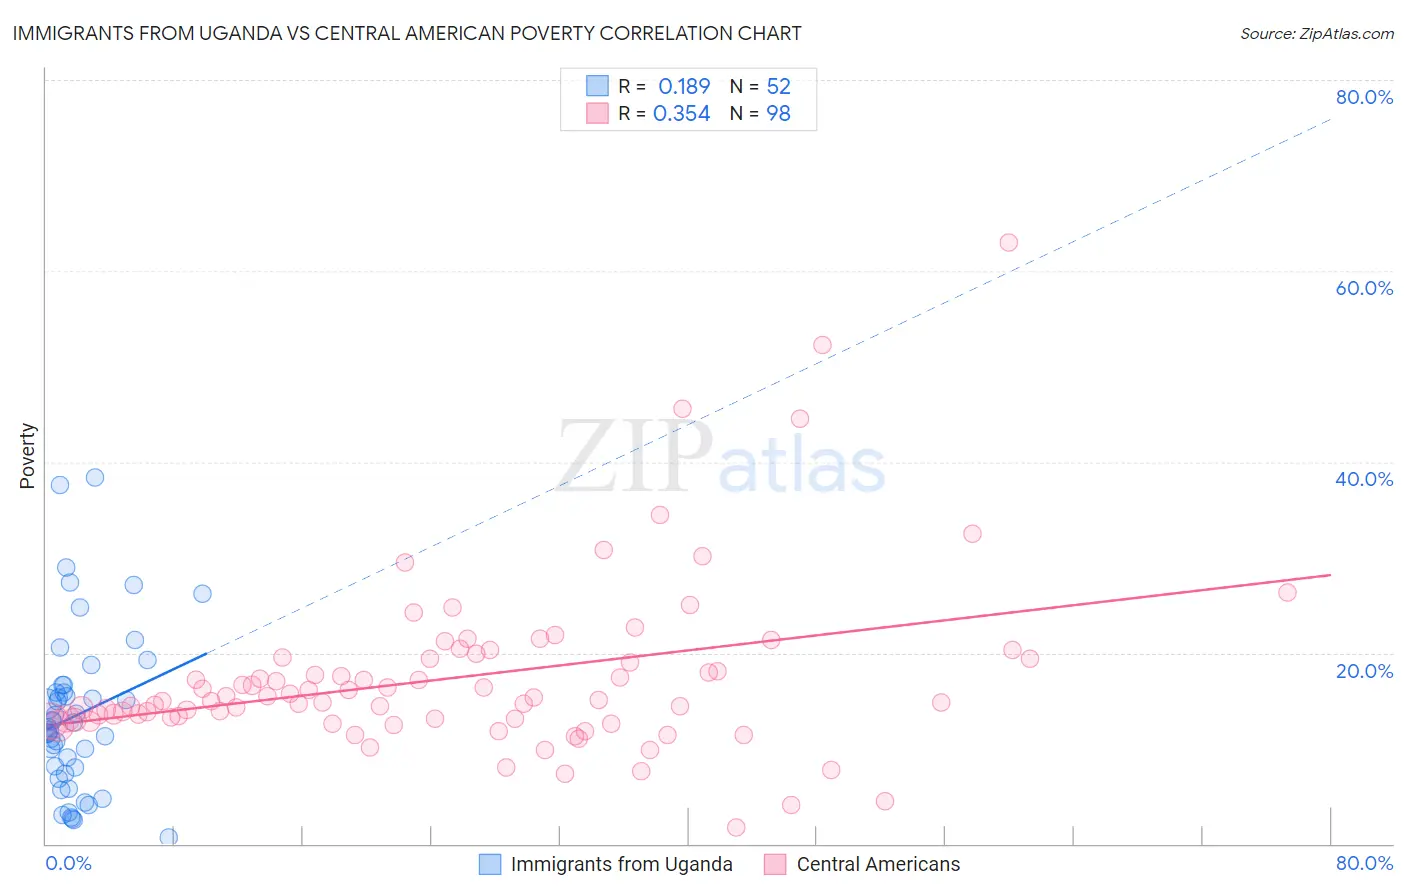
Immigrants from Uganda vs Central American Poverty Correlation Chart
The statistical analysis conducted on geographies consisting of 125,970,249 people shows a poor positive correlation between the proportion of Immigrants from Uganda and poverty level in the United States with a correlation coefficient (R) of 0.189 and weighted average of 12.8%. Similarly, the statistical analysis conducted on geographies consisting of 504,069,914 people shows a mild positive correlation between the proportion of Central Americans and poverty level in the United States with a correlation coefficient (R) of 0.354 and weighted average of 14.6%, a difference of 13.9%.
Poverty Correlation Summary
| Measurement | Immigrants from Uganda | Central American |
| Minimum | 0.63% | 1.8% |
| Maximum | 38.4% | 62.9% |
| Range | 37.8% | 61.2% |
| Mean | 13.5% | 17.4% |
| Median | 12.4% | 15.0% |
| Interquartile 25% (IQ1) | 7.7% | 13.0% |
| Interquartile 75% (IQ3) | 16.2% | 19.4% |
| Interquartile Range (IQR) | 8.6% | 6.3% |
| Standard Deviation (Sample) | 8.5% | 9.1% |
| Standard Deviation (Population) | 8.4% | 9.1% |
Similar Demographics by Poverty
Demographics Similar to Immigrants from Uganda by Poverty
In terms of poverty, the demographic groups most similar to Immigrants from Uganda are Spaniard (12.8%, a difference of 0.0%), Immigrants from Kenya (12.8%, a difference of 0.16%), Immigrants from Uruguay (12.8%, a difference of 0.16%), Hmong (12.8%, a difference of 0.26%), and Immigrants from Lebanon (12.8%, a difference of 0.35%).
| Demographics | Rating | Rank | Poverty |
| Arabs | 21.1 /100 | #194 | Fair 12.7% |
| Immigrants | Kuwait | 20.9 /100 | #195 | Fair 12.7% |
| Iraqis | 20.8 /100 | #196 | Fair 12.7% |
| Immigrants | Lebanon | 18.7 /100 | #197 | Poor 12.8% |
| Spanish | 18.7 /100 | #198 | Poor 12.8% |
| Immigrants | Kenya | 17.5 /100 | #199 | Poor 12.8% |
| Spaniards | 16.5 /100 | #200 | Poor 12.8% |
| Immigrants | Uganda | 16.5 /100 | #201 | Poor 12.8% |
| Immigrants | Uruguay | 15.6 /100 | #202 | Poor 12.8% |
| Hmong | 15.0 /100 | #203 | Poor 12.8% |
| Immigrants | Western Asia | 14.1 /100 | #204 | Poor 12.9% |
| Tsimshian | 9.2 /100 | #205 | Tragic 13.0% |
| Immigrants | Eastern Africa | 7.0 /100 | #206 | Tragic 13.1% |
| Panamanians | 6.6 /100 | #207 | Tragic 13.1% |
| Ugandans | 6.2 /100 | #208 | Tragic 13.1% |
Demographics Similar to Central Americans by Poverty
In terms of poverty, the demographic groups most similar to Central Americans are Immigrants from Cuba (14.6%, a difference of 0.14%), Subsaharan African (14.5%, a difference of 0.29%), Iroquois (14.5%, a difference of 0.33%), Shoshone (14.7%, a difference of 0.58%), and Chickasaw (14.7%, a difference of 0.63%).
| Demographics | Rating | Rank | Poverty |
| Jamaicans | 0.1 /100 | #263 | Tragic 14.4% |
| Immigrants | Jamaica | 0.1 /100 | #264 | Tragic 14.4% |
| Immigrants | Guyana | 0.1 /100 | #265 | Tragic 14.5% |
| Guyanese | 0.1 /100 | #266 | Tragic 14.5% |
| Iroquois | 0.1 /100 | #267 | Tragic 14.5% |
| Sub-Saharan Africans | 0.1 /100 | #268 | Tragic 14.5% |
| Immigrants | Cuba | 0.1 /100 | #269 | Tragic 14.6% |
| Central Americans | 0.1 /100 | #270 | Tragic 14.6% |
| Shoshone | 0.0 /100 | #271 | Tragic 14.7% |
| Chickasaw | 0.0 /100 | #272 | Tragic 14.7% |
| Spanish Americans | 0.0 /100 | #273 | Tragic 14.7% |
| Barbadians | 0.0 /100 | #274 | Tragic 14.8% |
| Immigrants | West Indies | 0.0 /100 | #275 | Tragic 14.8% |
| Immigrants | Bahamas | 0.0 /100 | #276 | Tragic 14.8% |
| Bangladeshis | 0.0 /100 | #277 | Tragic 14.8% |