Immigrants from Trinidad and Tobago vs Immigrants from Belize Average Family Size
COMPARE
Immigrants from Trinidad and Tobago
Immigrants from Belize
Average Family Size
Average Family Size Comparison
Immigrants from Trinidad and Tobago
Immigrants from Belize
3.33
AVERAGE FAMILY SIZE
99.9/ 100
METRIC RATING
70th/ 347
METRIC RANK
3.39
AVERAGE FAMILY SIZE
100.0/ 100
METRIC RATING
38th/ 347
METRIC RANK
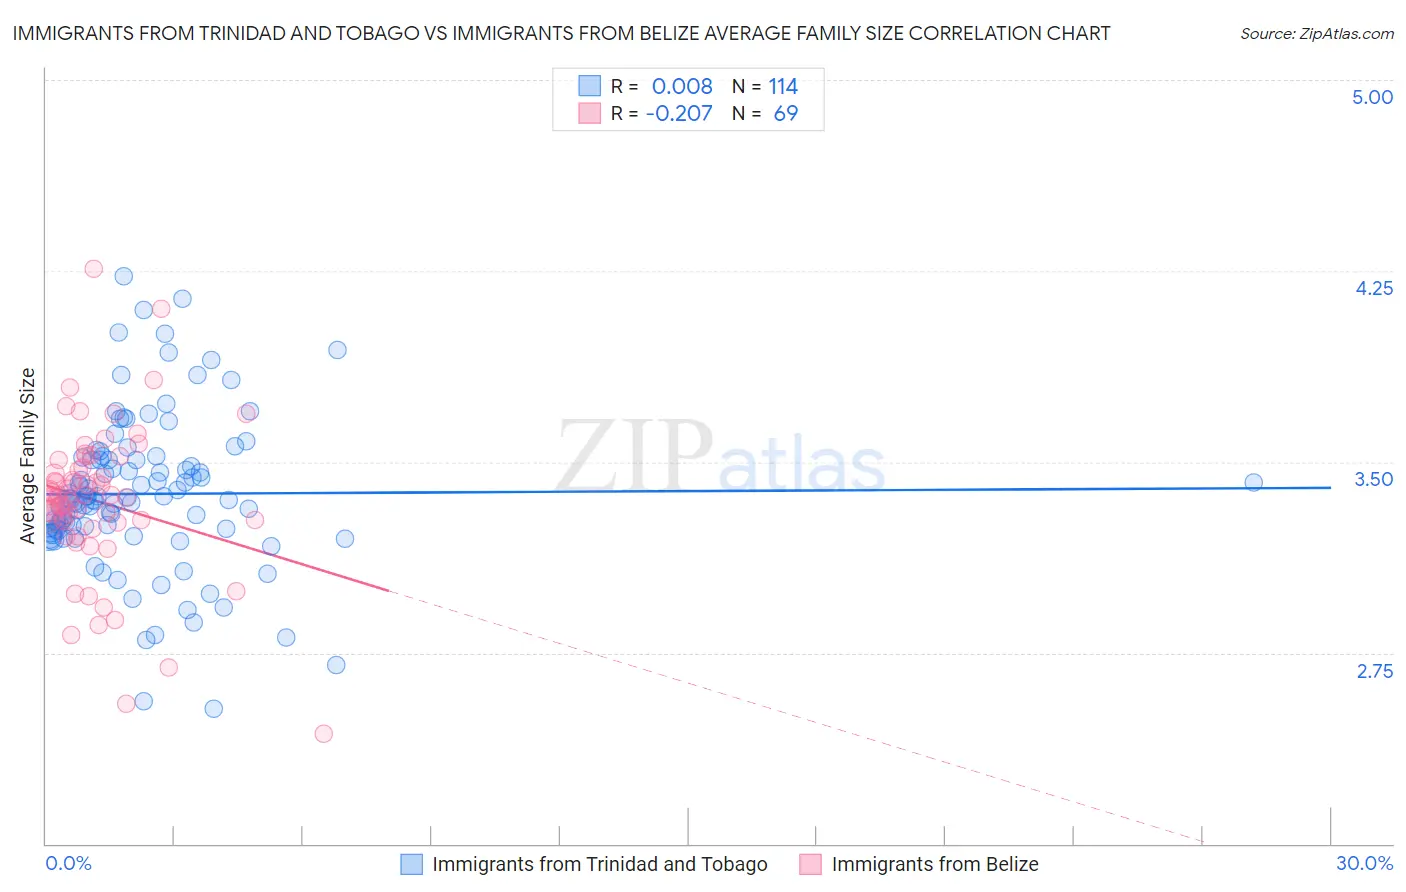
Immigrants from Trinidad and Tobago vs Immigrants from Belize Average Family Size Correlation Chart
The statistical analysis conducted on geographies consisting of 223,484,407 people shows no correlation between the proportion of Immigrants from Trinidad and Tobago and average family size in the United States with a correlation coefficient (R) of 0.008 and weighted average of 3.33. Similarly, the statistical analysis conducted on geographies consisting of 130,207,410 people shows a weak negative correlation between the proportion of Immigrants from Belize and average family size in the United States with a correlation coefficient (R) of -0.207 and weighted average of 3.39, a difference of 1.9%.
Average Family Size Correlation Summary
| Measurement | Immigrants from Trinidad and Tobago | Immigrants from Belize |
| Minimum | 2.53 | 2.43 |
| Maximum | 4.23 | 4.26 |
| Range | 1.70 | 1.83 |
| Mean | 3.37 | 3.35 |
| Median | 3.36 | 3.37 |
| Interquartile 25% (IQ1) | 3.23 | 3.26 |
| Interquartile 75% (IQ3) | 3.51 | 3.49 |
| Interquartile Range (IQR) | 0.28 | 0.23 |
| Standard Deviation (Sample) | 0.30 | 0.30 |
| Standard Deviation (Population) | 0.30 | 0.30 |
Similar Demographics by Average Family Size
Demographics Similar to Immigrants from Trinidad and Tobago by Average Family Size
In terms of average family size, the demographic groups most similar to Immigrants from Trinidad and Tobago are Immigrants from West Indies (3.33, a difference of 0.010%), Immigrants (3.33, a difference of 0.050%), Immigrants from Cambodia (3.33, a difference of 0.080%), Immigrants from Caribbean (3.33, a difference of 0.080%), and Yaqui (3.32, a difference of 0.11%).
| Demographics | Rating | Rank | Average Family Size |
| Chinese | 100.0 /100 | #63 | Exceptional 3.34 |
| Dominicans | 99.9 /100 | #64 | Exceptional 3.34 |
| Immigrants | Laos | 99.9 /100 | #65 | Exceptional 3.34 |
| Immigrants | St. Vincent and the Grenadines | 99.9 /100 | #66 | Exceptional 3.34 |
| Immigrants | Jamaica | 99.9 /100 | #67 | Exceptional 3.33 |
| Immigrants | Cambodia | 99.9 /100 | #68 | Exceptional 3.33 |
| Immigrants | Immigrants | 99.9 /100 | #69 | Exceptional 3.33 |
| Immigrants | Trinidad and Tobago | 99.9 /100 | #70 | Exceptional 3.33 |
| Immigrants | West Indies | 99.9 /100 | #71 | Exceptional 3.33 |
| Immigrants | Caribbean | 99.9 /100 | #72 | Exceptional 3.33 |
| Yaqui | 99.9 /100 | #73 | Exceptional 3.32 |
| Immigrants | Sierra Leone | 99.9 /100 | #74 | Exceptional 3.32 |
| Immigrants | Barbados | 99.8 /100 | #75 | Exceptional 3.32 |
| Trinidadians and Tobagonians | 99.8 /100 | #76 | Exceptional 3.32 |
| Immigrants | Ecuador | 99.8 /100 | #77 | Exceptional 3.32 |
Demographics Similar to Immigrants from Belize by Average Family Size
In terms of average family size, the demographic groups most similar to Immigrants from Belize are Immigrants from Haiti (3.39, a difference of 0.080%), Guyanese (3.40, a difference of 0.16%), Belizean (3.39, a difference of 0.20%), Immigrants from Guyana (3.40, a difference of 0.30%), and Guatemalan (3.40, a difference of 0.35%).
| Demographics | Rating | Rank | Average Family Size |
| Central Americans | 100.0 /100 | #31 | Exceptional 3.41 |
| Immigrants | Guatemala | 100.0 /100 | #32 | Exceptional 3.41 |
| Hawaiians | 100.0 /100 | #33 | Exceptional 3.41 |
| Hispanics or Latinos | 100.0 /100 | #34 | Exceptional 3.41 |
| Guatemalans | 100.0 /100 | #35 | Exceptional 3.40 |
| Immigrants | Guyana | 100.0 /100 | #36 | Exceptional 3.40 |
| Guyanese | 100.0 /100 | #37 | Exceptional 3.40 |
| Immigrants | Belize | 100.0 /100 | #38 | Exceptional 3.39 |
| Immigrants | Haiti | 100.0 /100 | #39 | Exceptional 3.39 |
| Belizeans | 100.0 /100 | #40 | Exceptional 3.39 |
| Marshallese | 100.0 /100 | #41 | Exceptional 3.38 |
| Immigrants | Vietnam | 100.0 /100 | #42 | Exceptional 3.38 |
| Immigrants | Philippines | 100.0 /100 | #43 | Exceptional 3.37 |
| Alaska Natives | 100.0 /100 | #44 | Exceptional 3.37 |
| Shoshone | 100.0 /100 | #45 | Exceptional 3.37 |