Immigrants from Trinidad and Tobago vs Laotian Divorced or Separated
COMPARE
Immigrants from Trinidad and Tobago
Laotian
Divorced or Separated
Divorced or Separated Comparison
Immigrants from Trinidad and Tobago
Laotians
12.2%
DIVORCED OR SEPARATED
17.8/ 100
METRIC RATING
209th/ 347
METRIC RANK
11.2%
DIVORCED OR SEPARATED
100.0/ 100
METRIC RATING
46th/ 347
METRIC RANK
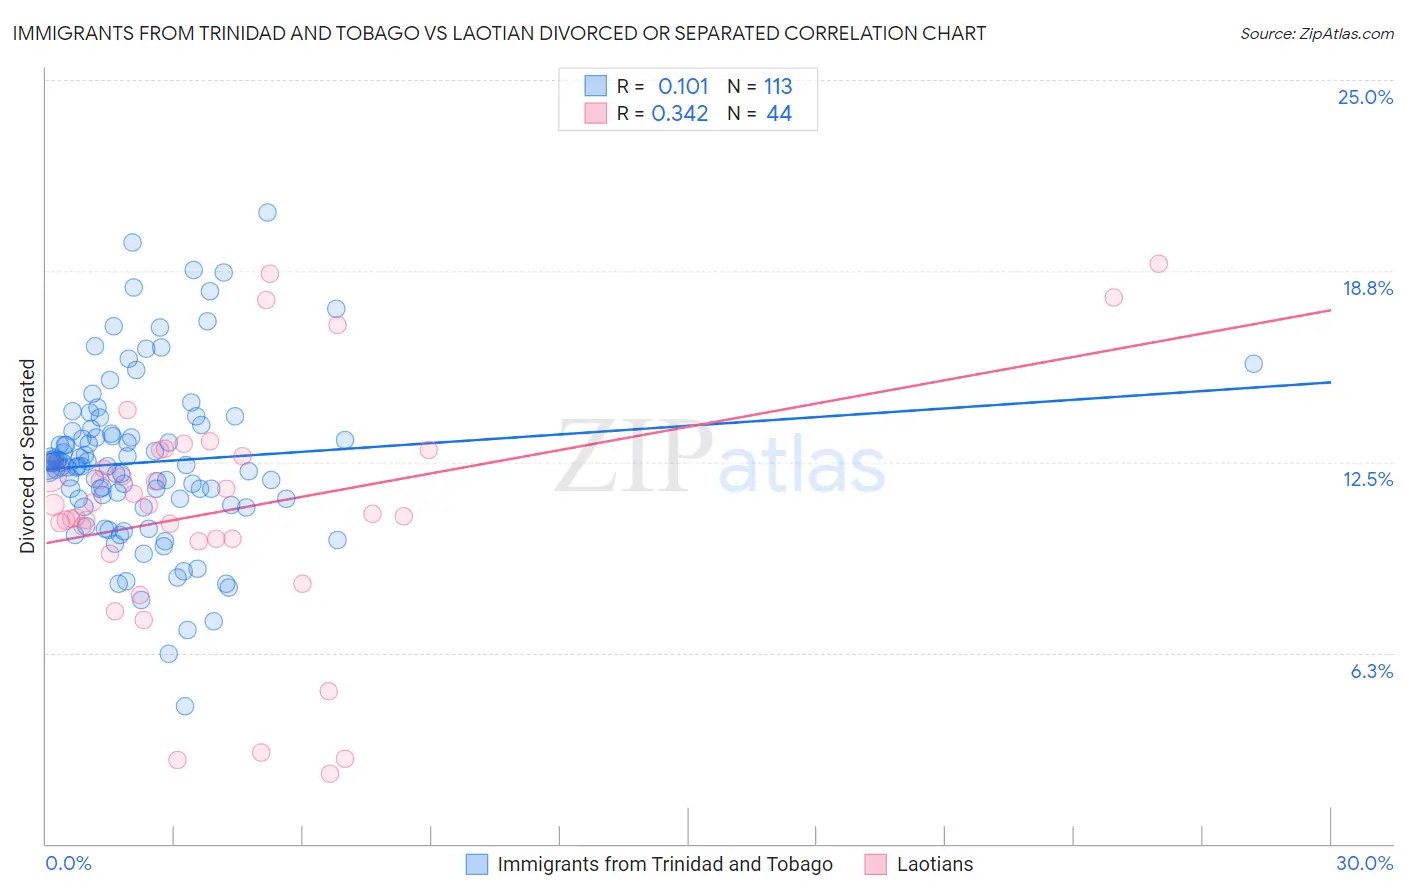
Immigrants from Trinidad and Tobago vs Laotian Divorced or Separated Correlation Chart
The statistical analysis conducted on geographies consisting of 223,519,445 people shows a poor positive correlation between the proportion of Immigrants from Trinidad and Tobago and percentage of population currently divorced or separated in the United States with a correlation coefficient (R) of 0.101 and weighted average of 12.2%. Similarly, the statistical analysis conducted on geographies consisting of 224,772,196 people shows a mild positive correlation between the proportion of Laotians and percentage of population currently divorced or separated in the United States with a correlation coefficient (R) of 0.342 and weighted average of 11.2%, a difference of 9.0%.
Divorced or Separated Correlation Summary
| Measurement | Immigrants from Trinidad and Tobago | Laotian |
| Minimum | 4.5% | 2.3% |
| Maximum | 20.6% | 19.0% |
| Range | 16.1% | 16.7% |
| Mean | 12.5% | 10.9% |
| Median | 12.4% | 10.9% |
| Interquartile 25% (IQ1) | 11.2% | 9.9% |
| Interquartile 75% (IQ3) | 13.5% | 12.8% |
| Interquartile Range (IQR) | 2.3% | 2.9% |
| Standard Deviation (Sample) | 2.7% | 3.9% |
| Standard Deviation (Population) | 2.7% | 3.8% |
Similar Demographics by Divorced or Separated
Demographics Similar to Immigrants from Trinidad and Tobago by Divorced or Separated
In terms of divorced or separated, the demographic groups most similar to Immigrants from Trinidad and Tobago are Immigrants from Ghana (12.2%, a difference of 0.050%), Slavic (12.2%, a difference of 0.050%), Trinidadian and Tobagonian (12.2%, a difference of 0.070%), Immigrants from Kenya (12.2%, a difference of 0.080%), and Immigrants from Eastern Africa (12.2%, a difference of 0.10%).
| Demographics | Rating | Rank | Divorced or Separated |
| Portuguese | 23.5 /100 | #202 | Fair 12.2% |
| Immigrants | Guatemala | 23.2 /100 | #203 | Fair 12.2% |
| Kenyans | 21.8 /100 | #204 | Fair 12.2% |
| Immigrants | Costa Rica | 21.3 /100 | #205 | Fair 12.2% |
| Slovaks | 21.0 /100 | #206 | Fair 12.2% |
| Mexicans | 21.0 /100 | #207 | Fair 12.2% |
| Immigrants | Ghana | 18.8 /100 | #208 | Poor 12.2% |
| Immigrants | Trinidad and Tobago | 17.8 /100 | #209 | Poor 12.2% |
| Slavs | 17.0 /100 | #210 | Poor 12.2% |
| Trinidadians and Tobagonians | 16.6 /100 | #211 | Poor 12.2% |
| Immigrants | Kenya | 16.5 /100 | #212 | Poor 12.2% |
| Immigrants | Eastern Africa | 16.2 /100 | #213 | Poor 12.2% |
| Immigrants | Argentina | 15.5 /100 | #214 | Poor 12.2% |
| Europeans | 15.4 /100 | #215 | Poor 12.2% |
| Immigrants | South America | 15.4 /100 | #216 | Poor 12.2% |
Demographics Similar to Laotians by Divorced or Separated
In terms of divorced or separated, the demographic groups most similar to Laotians are Immigrants from Poland (11.2%, a difference of 0.010%), Immigrants from Turkey (11.2%, a difference of 0.040%), Immigrants from Saudi Arabia (11.2%, a difference of 0.050%), Turkish (11.2%, a difference of 0.11%), and Bolivian (11.2%, a difference of 0.12%).
| Demographics | Rating | Rank | Divorced or Separated |
| Immigrants | Egypt | 100.0 /100 | #39 | Exceptional 11.1% |
| Soviet Union | 100.0 /100 | #40 | Exceptional 11.1% |
| Bhutanese | 100.0 /100 | #41 | Exceptional 11.2% |
| Chinese | 100.0 /100 | #42 | Exceptional 11.2% |
| Immigrants | Belarus | 100.0 /100 | #43 | Exceptional 11.2% |
| Immigrants | Western Asia | 100.0 /100 | #44 | Exceptional 11.2% |
| Turks | 100.0 /100 | #45 | Exceptional 11.2% |
| Laotians | 100.0 /100 | #46 | Exceptional 11.2% |
| Immigrants | Poland | 100.0 /100 | #47 | Exceptional 11.2% |
| Immigrants | Turkey | 100.0 /100 | #48 | Exceptional 11.2% |
| Immigrants | Saudi Arabia | 100.0 /100 | #49 | Exceptional 11.2% |
| Bolivians | 100.0 /100 | #50 | Exceptional 11.2% |
| Immigrants | Bolivia | 100.0 /100 | #51 | Exceptional 11.3% |
| Immigrants | Australia | 99.9 /100 | #52 | Exceptional 11.3% |
| Immigrants | Lithuania | 99.9 /100 | #53 | Exceptional 11.3% |