Immigrants from Trinidad and Tobago vs Malaysian Average Family Size
COMPARE
Immigrants from Trinidad and Tobago
Malaysian
Average Family Size
Average Family Size Comparison
Immigrants from Trinidad and Tobago
Malaysians
3.33
AVERAGE FAMILY SIZE
99.9/ 100
METRIC RATING
70th/ 347
METRIC RANK
3.31
AVERAGE FAMILY SIZE
99.6/ 100
METRIC RATING
89th/ 347
METRIC RANK
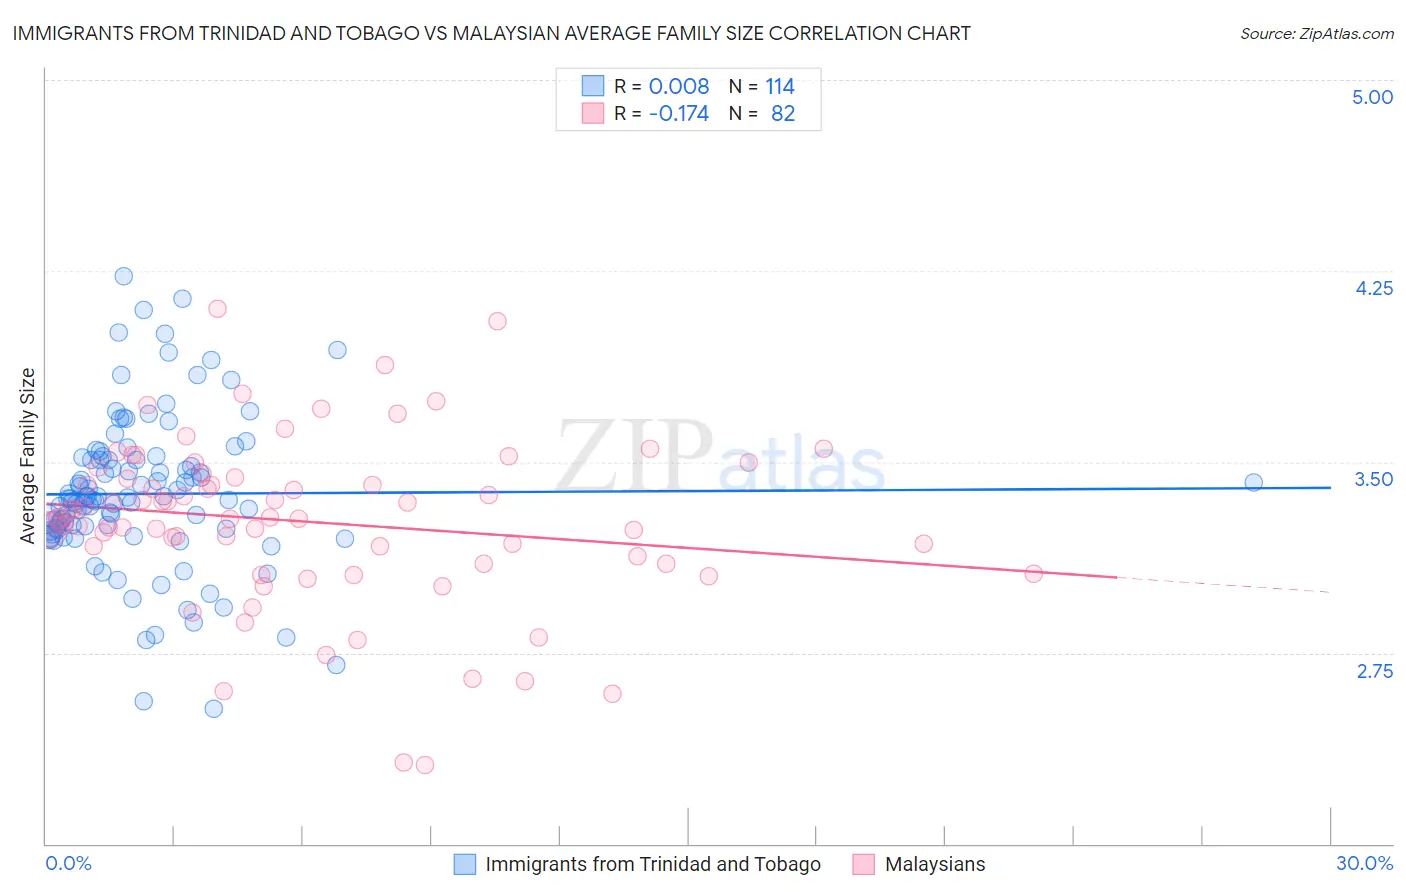
Immigrants from Trinidad and Tobago vs Malaysian Average Family Size Correlation Chart
The statistical analysis conducted on geographies consisting of 223,484,407 people shows no correlation between the proportion of Immigrants from Trinidad and Tobago and average family size in the United States with a correlation coefficient (R) of 0.008 and weighted average of 3.33. Similarly, the statistical analysis conducted on geographies consisting of 226,011,671 people shows a poor negative correlation between the proportion of Malaysians and average family size in the United States with a correlation coefficient (R) of -0.174 and weighted average of 3.31, a difference of 0.61%.
Average Family Size Correlation Summary
| Measurement | Immigrants from Trinidad and Tobago | Malaysian |
| Minimum | 2.53 | 2.31 |
| Maximum | 4.23 | 4.10 |
| Range | 1.70 | 1.79 |
| Mean | 3.37 | 3.26 |
| Median | 3.36 | 3.28 |
| Interquartile 25% (IQ1) | 3.23 | 3.10 |
| Interquartile 75% (IQ3) | 3.51 | 3.44 |
| Interquartile Range (IQR) | 0.28 | 0.34 |
| Standard Deviation (Sample) | 0.30 | 0.33 |
| Standard Deviation (Population) | 0.30 | 0.33 |
Demographics Similar to Immigrants from Trinidad and Tobago and Malaysians by Average Family Size
In terms of average family size, the demographic groups most similar to Immigrants from Trinidad and Tobago are Immigrants from West Indies (3.33, a difference of 0.010%), Immigrants (3.33, a difference of 0.050%), Immigrants from Caribbean (3.33, a difference of 0.080%), Yaqui (3.32, a difference of 0.11%), and Immigrants from Sierra Leone (3.32, a difference of 0.14%). Similarly, the demographic groups most similar to Malaysians are Immigrants from Bolivia (3.31, a difference of 0.010%), Immigrants from Peru (3.31, a difference of 0.10%), Jamaican (3.31, a difference of 0.15%), Afghan (3.31, a difference of 0.17%), and Immigrants from Nigeria (3.32, a difference of 0.21%).
| Demographics | Rating | Rank | Average Family Size |
| Immigrants | Immigrants | 99.9 /100 | #69 | Exceptional 3.33 |
| Immigrants | Trinidad and Tobago | 99.9 /100 | #70 | Exceptional 3.33 |
| Immigrants | West Indies | 99.9 /100 | #71 | Exceptional 3.33 |
| Immigrants | Caribbean | 99.9 /100 | #72 | Exceptional 3.33 |
| Yaqui | 99.9 /100 | #73 | Exceptional 3.32 |
| Immigrants | Sierra Leone | 99.9 /100 | #74 | Exceptional 3.32 |
| Immigrants | Barbados | 99.8 /100 | #75 | Exceptional 3.32 |
| Trinidadians and Tobagonians | 99.8 /100 | #76 | Exceptional 3.32 |
| Immigrants | Ecuador | 99.8 /100 | #77 | Exceptional 3.32 |
| Immigrants | Micronesia | 99.8 /100 | #78 | Exceptional 3.32 |
| British West Indians | 99.8 /100 | #79 | Exceptional 3.32 |
| Lumbee | 99.8 /100 | #80 | Exceptional 3.32 |
| Immigrants | Dominica | 99.8 /100 | #81 | Exceptional 3.32 |
| Ecuadorians | 99.8 /100 | #82 | Exceptional 3.32 |
| Immigrants | Afghanistan | 99.8 /100 | #83 | Exceptional 3.32 |
| Immigrants | Nigeria | 99.7 /100 | #84 | Exceptional 3.32 |
| Afghans | 99.7 /100 | #85 | Exceptional 3.31 |
| Jamaicans | 99.7 /100 | #86 | Exceptional 3.31 |
| Immigrants | Peru | 99.7 /100 | #87 | Exceptional 3.31 |
| Immigrants | Bolivia | 99.6 /100 | #88 | Exceptional 3.31 |
| Malaysians | 99.6 /100 | #89 | Exceptional 3.31 |