Immigrants from Trinidad and Tobago vs Laotian Disability Age Over 75
COMPARE
Immigrants from Trinidad and Tobago
Laotian
Disability Age Over 75
Disability Age Over 75 Comparison
Immigrants from Trinidad and Tobago
Laotians
47.6%
DISABILITY AGE OVER 75
25.3/ 100
METRIC RATING
195th/ 347
METRIC RANK
47.9%
DISABILITY AGE OVER 75
11.5/ 100
METRIC RATING
213th/ 347
METRIC RANK
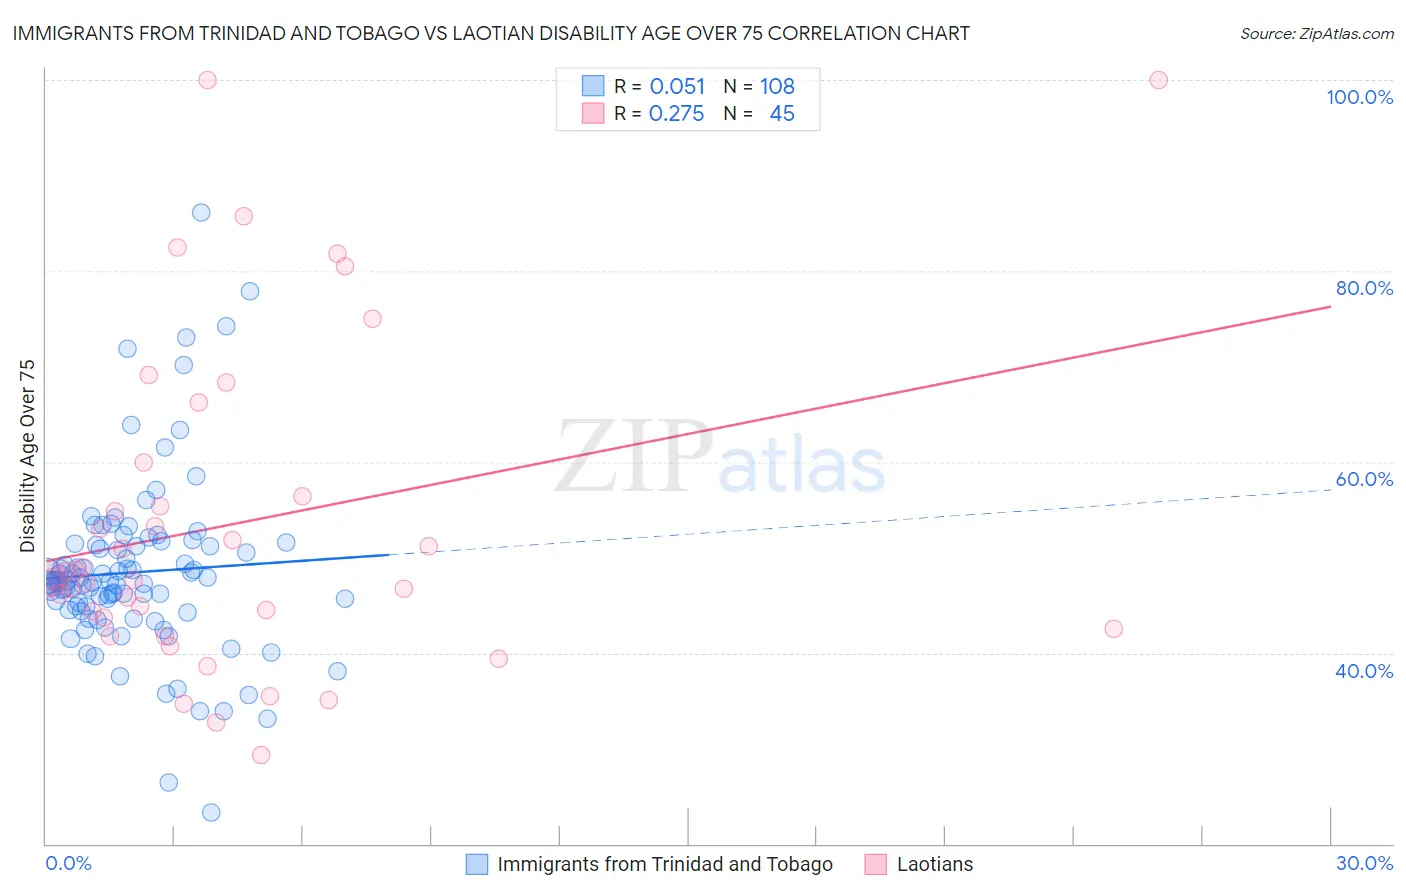
Immigrants from Trinidad and Tobago vs Laotian Disability Age Over 75 Correlation Chart
The statistical analysis conducted on geographies consisting of 223,345,670 people shows a slight positive correlation between the proportion of Immigrants from Trinidad and Tobago and percentage of population with a disability over the age of 75 in the United States with a correlation coefficient (R) of 0.051 and weighted average of 47.6%. Similarly, the statistical analysis conducted on geographies consisting of 224,625,451 people shows a weak positive correlation between the proportion of Laotians and percentage of population with a disability over the age of 75 in the United States with a correlation coefficient (R) of 0.275 and weighted average of 47.9%, a difference of 0.54%.
Disability Age Over 75 Correlation Summary
| Measurement | Immigrants from Trinidad and Tobago | Laotian |
| Minimum | 23.3% | 29.3% |
| Maximum | 86.1% | 100.0% |
| Range | 62.8% | 70.7% |
| Mean | 48.4% | 53.5% |
| Median | 47.4% | 47.8% |
| Interquartile 25% (IQ1) | 44.7% | 43.1% |
| Interquartile 75% (IQ3) | 51.2% | 58.2% |
| Interquartile Range (IQR) | 6.6% | 15.0% |
| Standard Deviation (Sample) | 9.2% | 17.0% |
| Standard Deviation (Population) | 9.1% | 16.8% |
Demographics Similar to Immigrants from Trinidad and Tobago and Laotians by Disability Age Over 75
In terms of disability age over 75, the demographic groups most similar to Immigrants from Trinidad and Tobago are Immigrants from Lebanon (47.6%, a difference of 0.030%), Immigrants from Portugal (47.6%, a difference of 0.050%), Pakistani (47.7%, a difference of 0.060%), Immigrants from Ukraine (47.7%, a difference of 0.060%), and Immigrants from Eritrea (47.7%, a difference of 0.090%). Similarly, the demographic groups most similar to Laotians are Immigrants from Burma/Myanmar (47.9%, a difference of 0.010%), Vietnamese (47.9%, a difference of 0.020%), Panamanian (47.9%, a difference of 0.020%), Immigrants from Barbados (47.9%, a difference of 0.040%), and Immigrants from Indonesia (47.8%, a difference of 0.14%).
| Demographics | Rating | Rank | Disability Age Over 75 |
| Immigrants | Lebanon | 26.5 /100 | #194 | Fair 47.6% |
| Immigrants | Trinidad and Tobago | 25.3 /100 | #195 | Fair 47.6% |
| Immigrants | Portugal | 23.8 /100 | #196 | Fair 47.6% |
| Pakistanis | 23.4 /100 | #197 | Fair 47.7% |
| Immigrants | Ukraine | 23.2 /100 | #198 | Fair 47.7% |
| Immigrants | Eritrea | 22.4 /100 | #199 | Fair 47.7% |
| Immigrants | Somalia | 21.4 /100 | #200 | Fair 47.7% |
| Immigrants | Cuba | 20.9 /100 | #201 | Fair 47.7% |
| Immigrants | Bahamas | 20.7 /100 | #202 | Fair 47.7% |
| Trinidadians and Tobagonians | 20.0 /100 | #203 | Fair 47.7% |
| Nigerians | 19.2 /100 | #204 | Poor 47.7% |
| Immigrants | Ghana | 19.1 /100 | #205 | Poor 47.7% |
| Jamaicans | 19.0 /100 | #206 | Poor 47.7% |
| Immigrants | Syria | 17.4 /100 | #207 | Poor 47.8% |
| Immigrants | Senegal | 16.9 /100 | #208 | Poor 47.8% |
| Immigrants | Indonesia | 14.2 /100 | #209 | Poor 47.8% |
| Vietnamese | 11.9 /100 | #210 | Poor 47.9% |
| Panamanians | 11.8 /100 | #211 | Poor 47.9% |
| Immigrants | Burma/Myanmar | 11.7 /100 | #212 | Poor 47.9% |
| Laotians | 11.5 /100 | #213 | Poor 47.9% |
| Immigrants | Barbados | 10.7 /100 | #214 | Poor 47.9% |