Immigrants from Russia vs Assyrian/Chaldean/Syriac Unemployment Among Youth under 25 years
COMPARE
Immigrants from Russia
Assyrian/Chaldean/Syriac
Unemployment Among Youth under 25 years
Unemployment Among Youth under 25 years Comparison
Immigrants from Russia
Assyrians/Chaldeans/Syriacs
11.7%
UNEMPLOYMENT AMONG YOUTH UNDER 25 YEARS
28.5/ 100
METRIC RATING
192nd/ 347
METRIC RANK
11.9%
UNEMPLOYMENT AMONG YOUTH UNDER 25 YEARS
9.8/ 100
METRIC RATING
210th/ 347
METRIC RANK
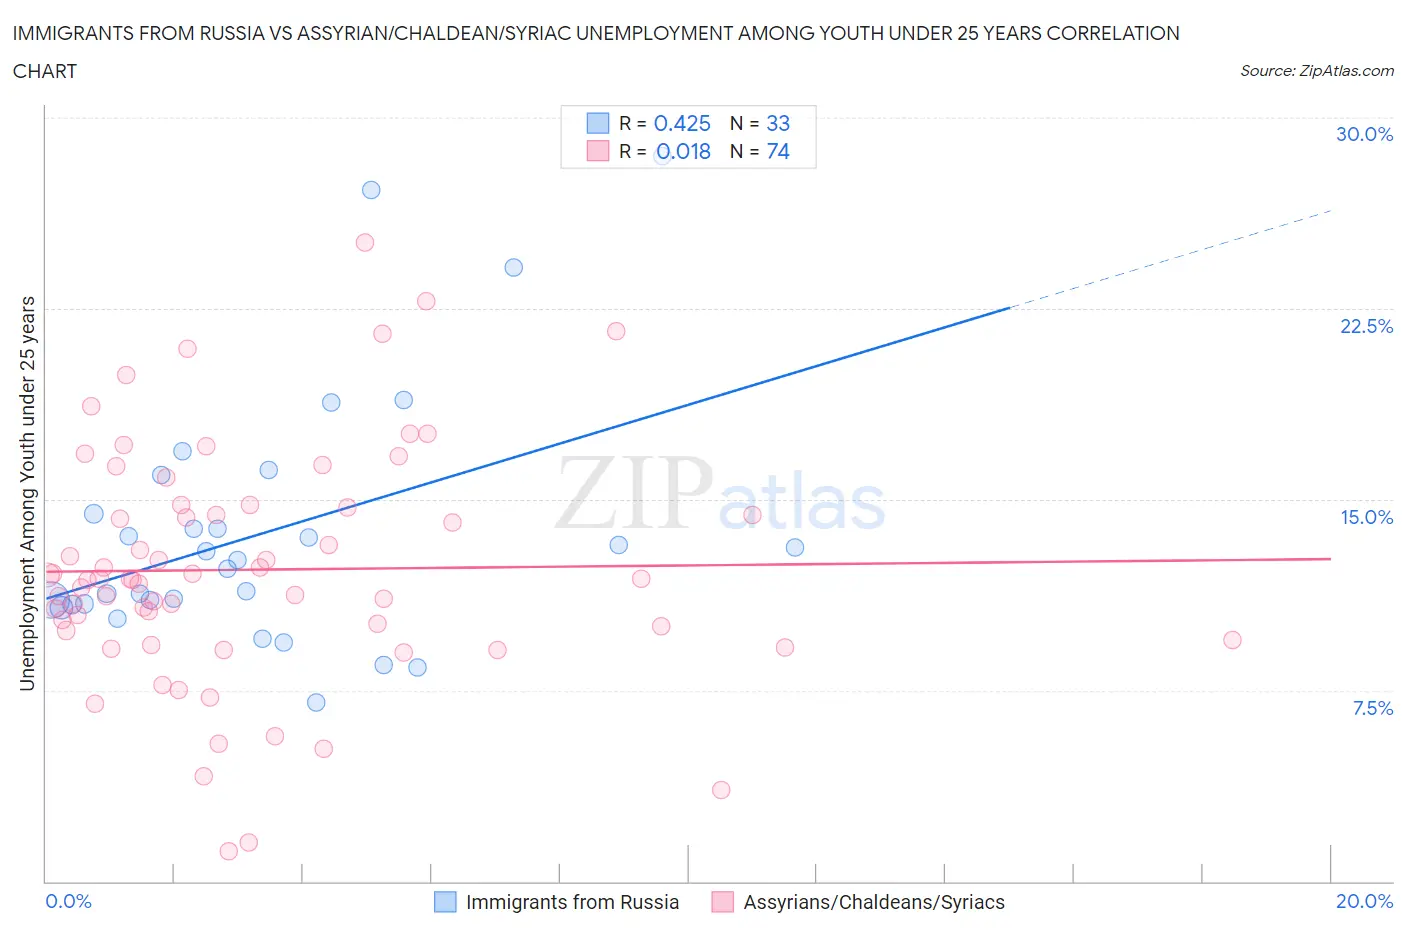
Immigrants from Russia vs Assyrian/Chaldean/Syriac Unemployment Among Youth under 25 years Correlation Chart
The statistical analysis conducted on geographies consisting of 344,363,065 people shows a moderate positive correlation between the proportion of Immigrants from Russia and unemployment rate among youth under the age of 25 in the United States with a correlation coefficient (R) of 0.425 and weighted average of 11.7%. Similarly, the statistical analysis conducted on geographies consisting of 109,923,358 people shows no correlation between the proportion of Assyrians/Chaldeans/Syriacs and unemployment rate among youth under the age of 25 in the United States with a correlation coefficient (R) of 0.018 and weighted average of 11.9%, a difference of 1.3%.
Unemployment Among Youth under 25 years Correlation Summary
| Measurement | Immigrants from Russia | Assyrian/Chaldean/Syriac |
| Minimum | 7.0% | 1.2% |
| Maximum | 28.5% | 25.1% |
| Range | 21.5% | 23.9% |
| Mean | 13.7% | 12.2% |
| Median | 12.6% | 11.9% |
| Interquartile 25% (IQ1) | 10.9% | 9.8% |
| Interquartile 75% (IQ3) | 15.2% | 14.7% |
| Interquartile Range (IQR) | 4.3% | 4.9% |
| Standard Deviation (Sample) | 5.0% | 4.6% |
| Standard Deviation (Population) | 4.9% | 4.6% |
Demographics Similar to Immigrants from Russia and Assyrians/Chaldeans/Syriacs by Unemployment Among Youth under 25 years
In terms of unemployment among youth under 25 years, the demographic groups most similar to Immigrants from Russia are Cypriot (11.7%, a difference of 0.0%), Seminole (11.7%, a difference of 0.030%), Immigrants from Sri Lanka (11.7%, a difference of 0.030%), Paraguayan (11.7%, a difference of 0.070%), and Egyptian (11.7%, a difference of 0.080%). Similarly, the demographic groups most similar to Assyrians/Chaldeans/Syriacs are Immigrants from Philippines (11.9%, a difference of 0.070%), Immigrants from Lebanon (11.8%, a difference of 0.15%), Comanche (11.8%, a difference of 0.23%), Immigrants from Southern Europe (11.8%, a difference of 0.25%), and Immigrants from Pakistan (11.8%, a difference of 0.28%).
| Demographics | Rating | Rank | Unemployment Among Youth under 25 years |
| Cypriots | 28.5 /100 | #191 | Fair 11.7% |
| Immigrants | Russia | 28.5 /100 | #192 | Fair 11.7% |
| Seminole | 27.9 /100 | #193 | Fair 11.7% |
| Immigrants | Sri Lanka | 27.8 /100 | #194 | Fair 11.7% |
| Paraguayans | 27.2 /100 | #195 | Fair 11.7% |
| Egyptians | 26.9 /100 | #196 | Fair 11.7% |
| Koreans | 23.9 /100 | #197 | Fair 11.7% |
| Cherokee | 21.2 /100 | #198 | Fair 11.8% |
| Immigrants | Colombia | 20.9 /100 | #199 | Fair 11.8% |
| Arabs | 18.0 /100 | #200 | Poor 11.8% |
| Palestinians | 16.0 /100 | #201 | Poor 11.8% |
| Marshallese | 15.8 /100 | #202 | Poor 11.8% |
| Immigrants | Peru | 15.3 /100 | #203 | Poor 11.8% |
| Immigrants | Costa Rica | 15.2 /100 | #204 | Poor 11.8% |
| Peruvians | 14.0 /100 | #205 | Poor 11.8% |
| Immigrants | Pakistan | 12.6 /100 | #206 | Poor 11.8% |
| Immigrants | Southern Europe | 12.3 /100 | #207 | Poor 11.8% |
| Comanche | 12.1 /100 | #208 | Poor 11.8% |
| Immigrants | Lebanon | 11.3 /100 | #209 | Poor 11.8% |
| Assyrians/Chaldeans/Syriacs | 9.8 /100 | #210 | Tragic 11.9% |
| Immigrants | Philippines | 9.2 /100 | #211 | Tragic 11.9% |