Chilean vs Assyrian/Chaldean/Syriac Married-couple Households
COMPARE
Chilean
Assyrian/Chaldean/Syriac
Married-couple Households
Married-couple Households Comparison
Chileans
Assyrians/Chaldeans/Syriacs
47.5%
MARRIED-COUPLE HOUSEHOLDS
92.2/ 100
METRIC RATING
119th/ 347
METRIC RANK
51.8%
MARRIED-COUPLE HOUSEHOLDS
100.0/ 100
METRIC RATING
4th/ 347
METRIC RANK
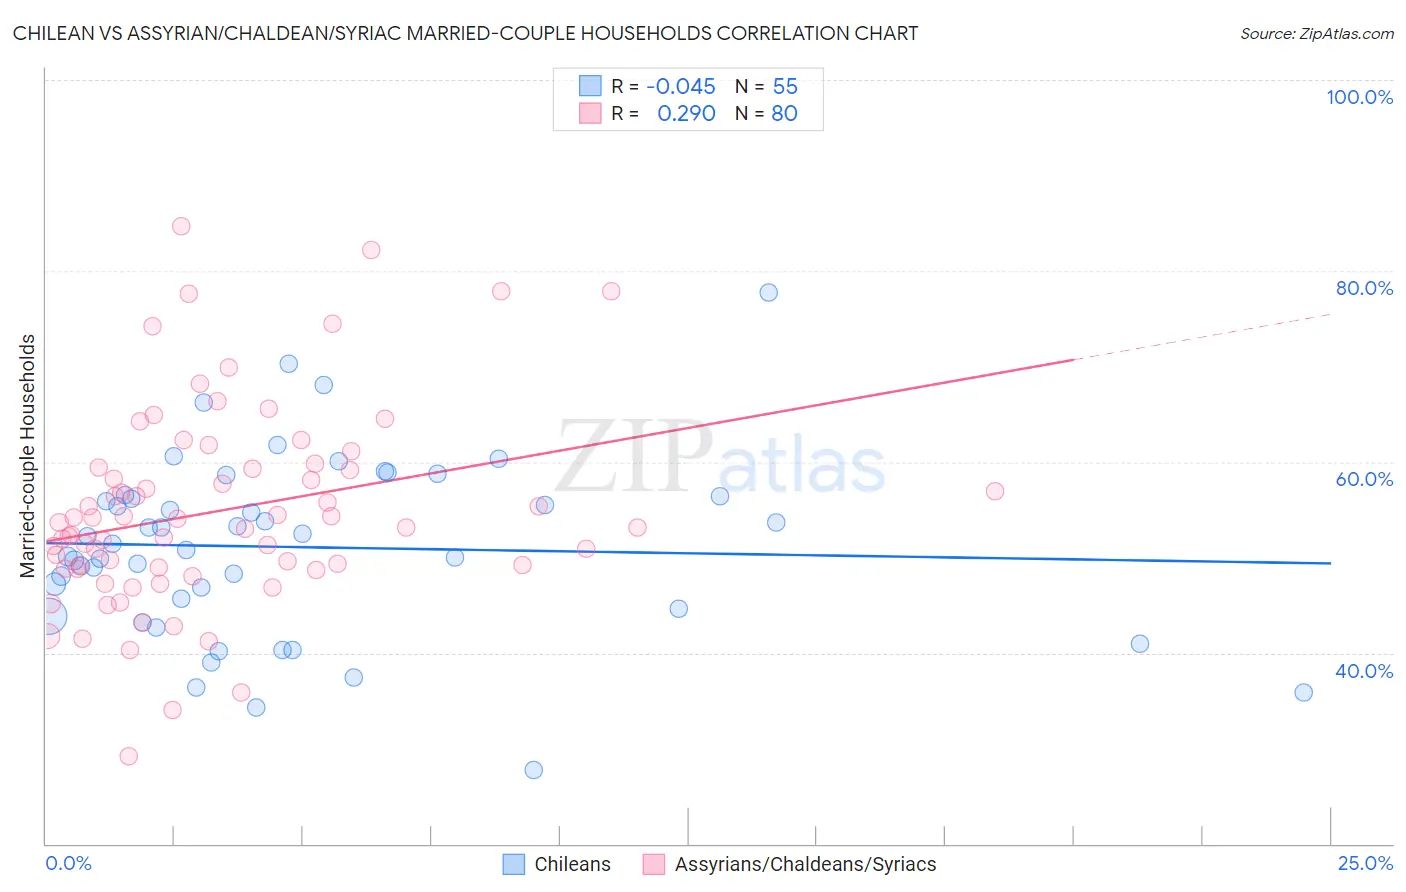
Chilean vs Assyrian/Chaldean/Syriac Married-couple Households Correlation Chart
The statistical analysis conducted on geographies consisting of 256,556,346 people shows no correlation between the proportion of Chileans and percentage of married-couple family households in the United States with a correlation coefficient (R) of -0.045 and weighted average of 47.5%. Similarly, the statistical analysis conducted on geographies consisting of 110,294,582 people shows a weak positive correlation between the proportion of Assyrians/Chaldeans/Syriacs and percentage of married-couple family households in the United States with a correlation coefficient (R) of 0.290 and weighted average of 51.8%, a difference of 9.0%.
Married-couple Households Correlation Summary
| Measurement | Chilean | Assyrian/Chaldean/Syriac |
| Minimum | 27.7% | 29.2% |
| Maximum | 77.8% | 84.7% |
| Range | 50.1% | 55.5% |
| Mean | 51.1% | 54.9% |
| Median | 51.4% | 53.4% |
| Interquartile 25% (IQ1) | 44.6% | 48.9% |
| Interquartile 75% (IQ3) | 56.4% | 59.3% |
| Interquartile Range (IQR) | 11.8% | 10.4% |
| Standard Deviation (Sample) | 9.4% | 10.5% |
| Standard Deviation (Population) | 9.3% | 10.4% |
Similar Demographics by Married-couple Households
Demographics Similar to Chileans by Married-couple Households
In terms of married-couple households, the demographic groups most similar to Chileans are French Canadian (47.5%, a difference of 0.030%), Immigrants from Germany (47.5%, a difference of 0.030%), Argentinean (47.5%, a difference of 0.050%), Slovak (47.6%, a difference of 0.10%), and Puget Sound Salish (47.4%, a difference of 0.19%).
| Demographics | Rating | Rank | Married-couple Households |
| Peruvians | 93.8 /100 | #112 | Exceptional 47.6% |
| Venezuelans | 93.8 /100 | #113 | Exceptional 47.6% |
| Immigrants | Europe | 93.7 /100 | #114 | Exceptional 47.6% |
| Slovaks | 92.9 /100 | #115 | Exceptional 47.6% |
| Argentineans | 92.5 /100 | #116 | Exceptional 47.5% |
| French Canadians | 92.4 /100 | #117 | Exceptional 47.5% |
| Immigrants | Germany | 92.4 /100 | #118 | Exceptional 47.5% |
| Chileans | 92.2 /100 | #119 | Exceptional 47.5% |
| Puget Sound Salish | 90.5 /100 | #120 | Exceptional 47.4% |
| Immigrants | Eastern Europe | 90.3 /100 | #121 | Exceptional 47.4% |
| Okinawans | 90.1 /100 | #122 | Exceptional 47.4% |
| Immigrants | Venezuela | 89.3 /100 | #123 | Excellent 47.4% |
| Zimbabweans | 89.2 /100 | #124 | Excellent 47.4% |
| Australians | 89.0 /100 | #125 | Excellent 47.4% |
| Pakistanis | 88.6 /100 | #126 | Excellent 47.3% |
Demographics Similar to Assyrians/Chaldeans/Syriacs by Married-couple Households
In terms of married-couple households, the demographic groups most similar to Assyrians/Chaldeans/Syriacs are Thai (51.9%, a difference of 0.21%), Tongan (51.6%, a difference of 0.48%), Immigrants from Taiwan (52.4%, a difference of 1.2%), Danish (51.1%, a difference of 1.5%), and Filipino (51.0%, a difference of 1.7%).
| Demographics | Rating | Rank | Married-couple Households |
| Immigrants | India | 100.0 /100 | #1 | Exceptional 52.7% |
| Immigrants | Taiwan | 100.0 /100 | #2 | Exceptional 52.4% |
| Thais | 100.0 /100 | #3 | Exceptional 51.9% |
| Assyrians/Chaldeans/Syriacs | 100.0 /100 | #4 | Exceptional 51.8% |
| Tongans | 100.0 /100 | #5 | Exceptional 51.6% |
| Danes | 100.0 /100 | #6 | Exceptional 51.1% |
| Filipinos | 100.0 /100 | #7 | Exceptional 51.0% |
| Immigrants | South Central Asia | 100.0 /100 | #8 | Exceptional 50.6% |
| Pennsylvania Germans | 100.0 /100 | #9 | Exceptional 50.4% |
| Chinese | 100.0 /100 | #10 | Exceptional 50.4% |
| Immigrants | Pakistan | 100.0 /100 | #11 | Exceptional 50.1% |
| Swiss | 100.0 /100 | #12 | Exceptional 49.9% |
| Immigrants | Korea | 100.0 /100 | #13 | Exceptional 49.9% |
| Burmese | 100.0 /100 | #14 | Exceptional 49.8% |
| Koreans | 99.9 /100 | #15 | Exceptional 49.7% |