Immigrants from Oceania vs Paiute Family Households
COMPARE
Immigrants from Oceania
Paiute
Family Households
Family Households Comparison
Immigrants from Oceania
Paiute
64.9%
FAMILY HOUSEHOLDS
94.2/ 100
METRIC RATING
120th/ 347
METRIC RANK
64.0%
FAMILY HOUSEHOLDS
22.2/ 100
METRIC RATING
194th/ 347
METRIC RANK
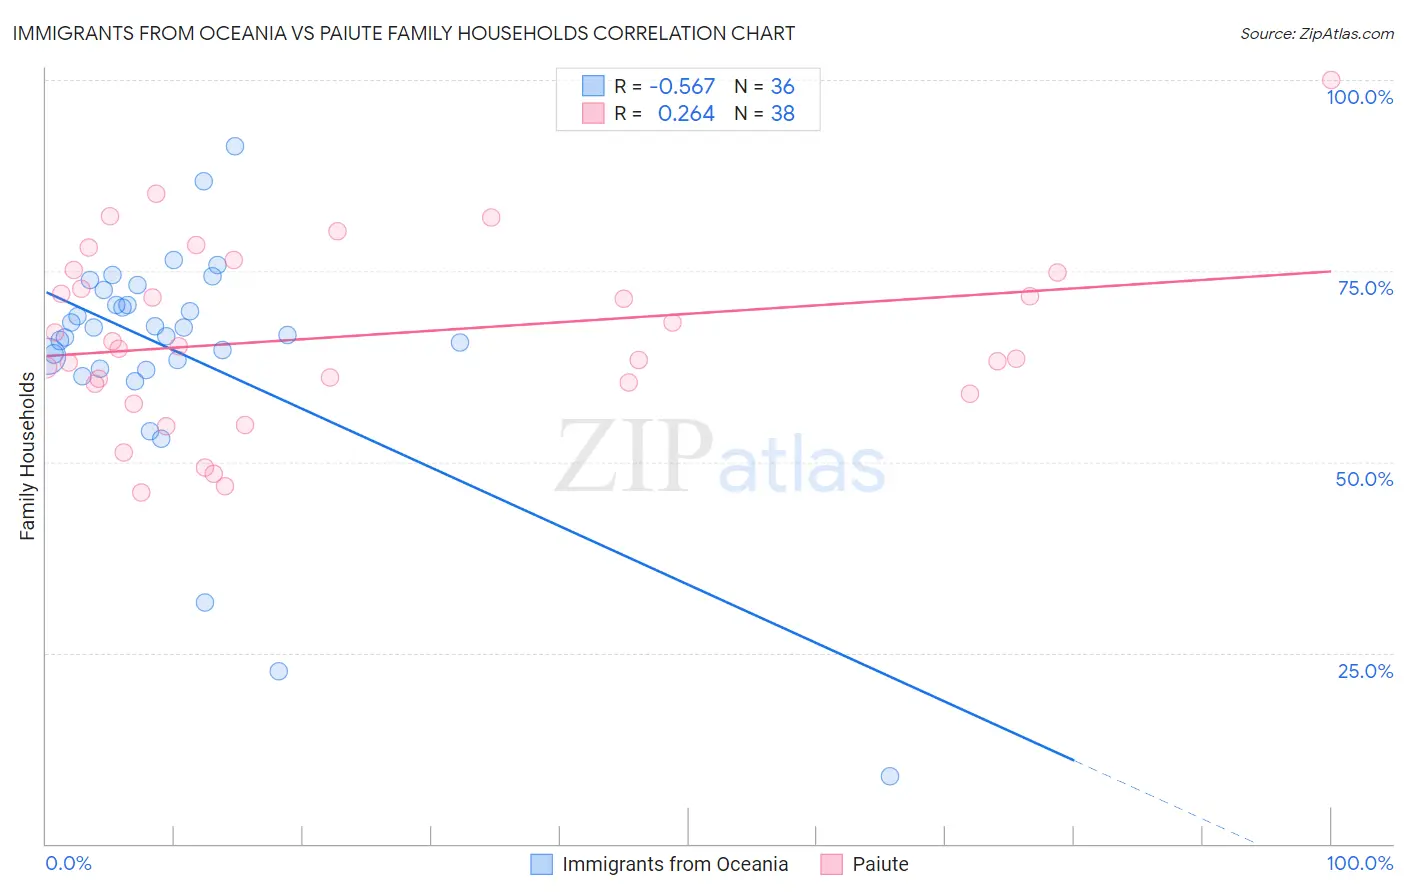
Immigrants from Oceania vs Paiute Family Households Correlation Chart
The statistical analysis conducted on geographies consisting of 305,389,085 people shows a substantial negative correlation between the proportion of Immigrants from Oceania and percentage of family households in the United States with a correlation coefficient (R) of -0.567 and weighted average of 64.9%. Similarly, the statistical analysis conducted on geographies consisting of 58,392,138 people shows a weak positive correlation between the proportion of Paiute and percentage of family households in the United States with a correlation coefficient (R) of 0.264 and weighted average of 64.0%, a difference of 1.4%.
Family Households Correlation Summary
| Measurement | Immigrants from Oceania | Paiute |
| Minimum | 8.8% | 46.0% |
| Maximum | 91.4% | 100.0% |
| Range | 82.6% | 54.0% |
| Mean | 64.5% | 66.5% |
| Median | 67.1% | 65.0% |
| Interquartile 25% (IQ1) | 62.7% | 60.2% |
| Interquartile 75% (IQ3) | 71.6% | 74.8% |
| Interquartile Range (IQR) | 8.8% | 14.6% |
| Standard Deviation (Sample) | 15.4% | 11.7% |
| Standard Deviation (Population) | 15.2% | 11.6% |
Similar Demographics by Family Households
Demographics Similar to Immigrants from Oceania by Family Households
In terms of family households, the demographic groups most similar to Immigrants from Oceania are Immigrants from Eastern Asia (64.9%, a difference of 0.010%), Hungarian (64.9%, a difference of 0.010%), Hmong (64.9%, a difference of 0.050%), Choctaw (64.9%, a difference of 0.050%), and Dutch (64.9%, a difference of 0.060%).
| Demographics | Rating | Rank | Family Households |
| Spanish | 96.2 /100 | #113 | Exceptional 65.0% |
| Argentineans | 95.7 /100 | #114 | Exceptional 65.0% |
| Ecuadorians | 95.4 /100 | #115 | Exceptional 65.0% |
| Immigrants | Iraq | 95.4 /100 | #116 | Exceptional 65.0% |
| Cherokee | 95.3 /100 | #117 | Exceptional 65.0% |
| Dutch | 95.1 /100 | #118 | Exceptional 64.9% |
| Immigrants | Eastern Asia | 94.4 /100 | #119 | Exceptional 64.9% |
| Immigrants | Oceania | 94.2 /100 | #120 | Exceptional 64.9% |
| Hungarians | 94.0 /100 | #121 | Exceptional 64.9% |
| Hmong | 93.4 /100 | #122 | Exceptional 64.9% |
| Choctaw | 93.4 /100 | #123 | Exceptional 64.9% |
| Immigrants | Argentina | 92.8 /100 | #124 | Exceptional 64.9% |
| Immigrants | Belize | 92.7 /100 | #125 | Exceptional 64.9% |
| Panamanians | 92.4 /100 | #126 | Exceptional 64.8% |
| Immigrants | Panama | 92.0 /100 | #127 | Exceptional 64.8% |
Demographics Similar to Paiute by Family Households
In terms of family households, the demographic groups most similar to Paiute are Lithuanian (64.0%, a difference of 0.030%), French (64.0%, a difference of 0.030%), Arab (64.1%, a difference of 0.040%), Immigrants from North America (64.0%, a difference of 0.040%), and Zimbabwean (64.1%, a difference of 0.050%).
| Demographics | Rating | Rank | Family Households |
| Northern Europeans | 28.2 /100 | #187 | Fair 64.1% |
| Paraguayans | 26.7 /100 | #188 | Fair 64.1% |
| Immigrants | Western Asia | 25.3 /100 | #189 | Fair 64.1% |
| Zimbabweans | 24.7 /100 | #190 | Fair 64.1% |
| Arabs | 24.5 /100 | #191 | Fair 64.1% |
| Lithuanians | 23.8 /100 | #192 | Fair 64.0% |
| French | 23.7 /100 | #193 | Fair 64.0% |
| Paiute | 22.2 /100 | #194 | Fair 64.0% |
| Immigrants | North America | 20.0 /100 | #195 | Poor 64.0% |
| Immigrants | Canada | 19.2 /100 | #196 | Poor 64.0% |
| Seminole | 18.9 /100 | #197 | Poor 64.0% |
| Poles | 18.9 /100 | #198 | Poor 64.0% |
| Slavs | 18.6 /100 | #199 | Poor 64.0% |
| Immigrants | Malaysia | 17.9 /100 | #200 | Poor 64.0% |
| Immigrants | Eastern Europe | 17.2 /100 | #201 | Poor 64.0% |