Immigrants from Oceania vs Paiute Family Poverty
COMPARE
Immigrants from Oceania
Paiute
Family Poverty
Family Poverty Comparison
Immigrants from Oceania
Paiute
8.7%
FAMILY POVERTY
71.2/ 100
METRIC RATING
156th/ 347
METRIC RANK
13.0%
FAMILY POVERTY
0.0/ 100
METRIC RATING
325th/ 347
METRIC RANK
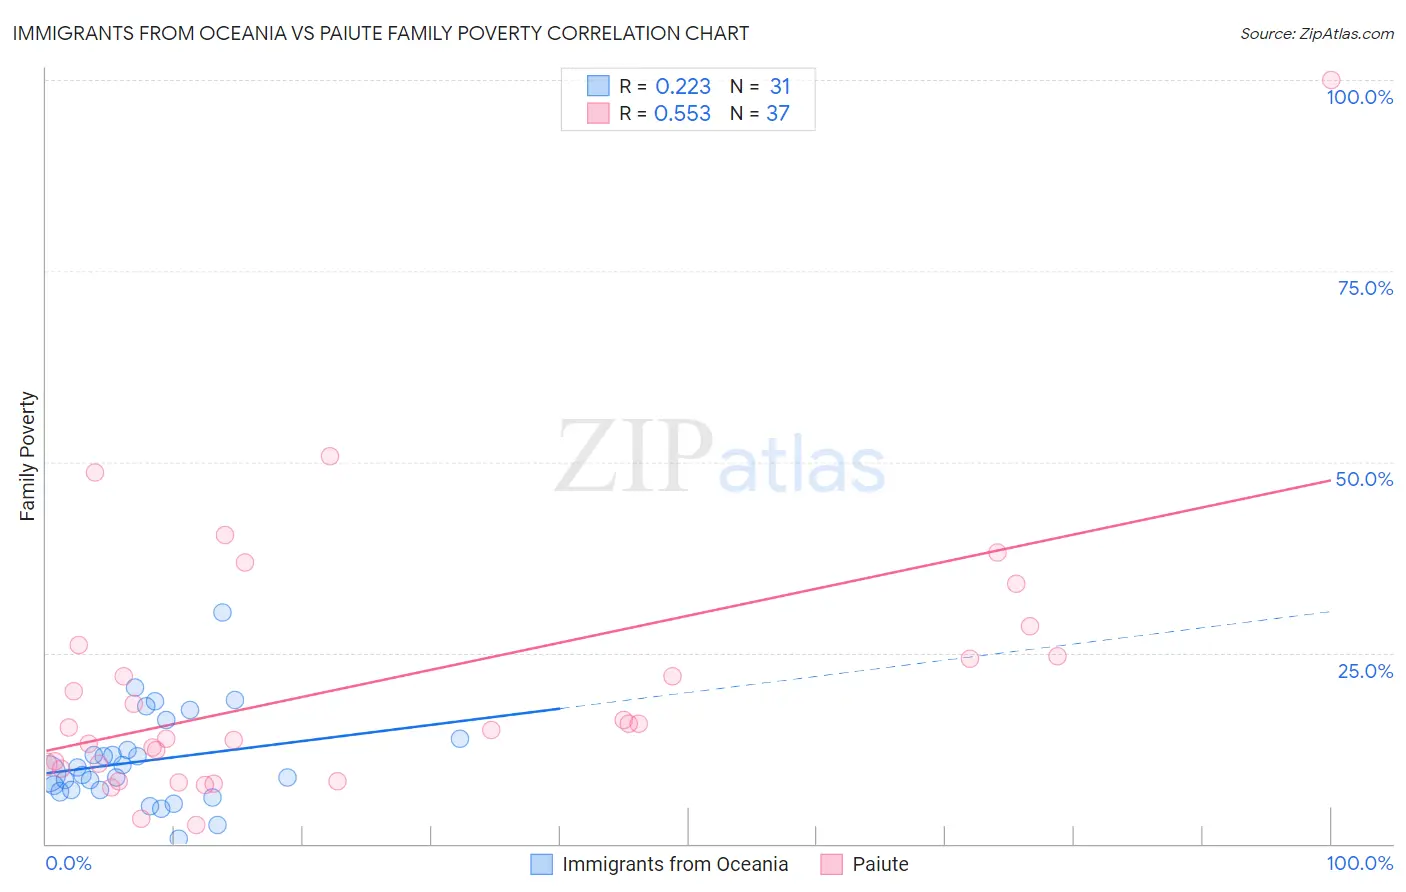
Immigrants from Oceania vs Paiute Family Poverty Correlation Chart
The statistical analysis conducted on geographies consisting of 304,831,685 people shows a weak positive correlation between the proportion of Immigrants from Oceania and poverty level among families in the United States with a correlation coefficient (R) of 0.223 and weighted average of 8.7%. Similarly, the statistical analysis conducted on geographies consisting of 58,372,907 people shows a substantial positive correlation between the proportion of Paiute and poverty level among families in the United States with a correlation coefficient (R) of 0.553 and weighted average of 13.0%, a difference of 48.7%.
Family Poverty Correlation Summary
| Measurement | Immigrants from Oceania | Paiute |
| Minimum | 0.73% | 2.4% |
| Maximum | 30.3% | 100.0% |
| Range | 29.6% | 97.6% |
| Mean | 10.9% | 20.9% |
| Median | 9.1% | 15.2% |
| Interquartile 25% (IQ1) | 7.0% | 10.1% |
| Interquartile 75% (IQ3) | 13.8% | 25.3% |
| Interquartile Range (IQR) | 6.7% | 15.2% |
| Standard Deviation (Sample) | 6.1% | 18.0% |
| Standard Deviation (Population) | 6.0% | 17.8% |
Similar Demographics by Family Poverty
Demographics Similar to Immigrants from Oceania by Family Poverty
In terms of family poverty, the demographic groups most similar to Immigrants from Oceania are Tsimshian (8.8%, a difference of 0.30%), White/Caucasian (8.8%, a difference of 0.34%), Immigrants from Kuwait (8.7%, a difference of 0.40%), Peruvian (8.8%, a difference of 0.50%), and Hungarian (8.8%, a difference of 0.64%).
| Demographics | Rating | Rank | Family Poverty |
| Mongolians | 80.4 /100 | #149 | Excellent 8.6% |
| Syrians | 80.3 /100 | #150 | Excellent 8.6% |
| Brazilians | 80.1 /100 | #151 | Excellent 8.6% |
| Samoans | 79.8 /100 | #152 | Good 8.6% |
| Immigrants | Spain | 79.1 /100 | #153 | Good 8.6% |
| Immigrants | Vietnam | 75.4 /100 | #154 | Good 8.7% |
| Immigrants | Kuwait | 73.6 /100 | #155 | Good 8.7% |
| Immigrants | Oceania | 71.2 /100 | #156 | Good 8.7% |
| Tsimshian | 69.3 /100 | #157 | Good 8.8% |
| Whites/Caucasians | 69.1 /100 | #158 | Good 8.8% |
| Peruvians | 68.0 /100 | #159 | Good 8.8% |
| Hungarians | 67.2 /100 | #160 | Good 8.8% |
| Immigrants | Northern Africa | 66.9 /100 | #161 | Good 8.8% |
| Ethiopians | 66.3 /100 | #162 | Good 8.8% |
| Pennsylvania Germans | 66.0 /100 | #163 | Good 8.8% |
Demographics Similar to Paiute by Family Poverty
In terms of family poverty, the demographic groups most similar to Paiute are Colville (13.0%, a difference of 0.060%), Yakama (13.1%, a difference of 0.75%), Immigrants from Dominica (12.7%, a difference of 2.0%), Menominee (12.7%, a difference of 2.0%), and Central American Indian (13.3%, a difference of 2.4%).
| Demographics | Rating | Rank | Family Poverty |
| U.S. Virgin Islanders | 0.0 /100 | #318 | Tragic 12.4% |
| British West Indians | 0.0 /100 | #319 | Tragic 12.4% |
| Inupiat | 0.0 /100 | #320 | Tragic 12.5% |
| Arapaho | 0.0 /100 | #321 | Tragic 12.7% |
| Immigrants | Honduras | 0.0 /100 | #322 | Tragic 12.7% |
| Menominee | 0.0 /100 | #323 | Tragic 12.7% |
| Immigrants | Dominica | 0.0 /100 | #324 | Tragic 12.7% |
| Paiute | 0.0 /100 | #325 | Tragic 13.0% |
| Colville | 0.0 /100 | #326 | Tragic 13.0% |
| Yakama | 0.0 /100 | #327 | Tragic 13.1% |
| Central American Indians | 0.0 /100 | #328 | Tragic 13.3% |
| Blacks/African Americans | 0.0 /100 | #329 | Tragic 13.3% |
| Natives/Alaskans | 0.0 /100 | #330 | Tragic 14.3% |
| Cheyenne | 0.0 /100 | #331 | Tragic 14.3% |
| Dominicans | 0.0 /100 | #332 | Tragic 14.3% |