Immigrants from Oceania vs Spaniard Family Households
COMPARE
Immigrants from Oceania
Spaniard
Family Households
Family Households Comparison
Immigrants from Oceania
Spaniards
64.9%
FAMILY HOUSEHOLDS
94.2/ 100
METRIC RATING
120th/ 347
METRIC RANK
65.1%
FAMILY HOUSEHOLDS
97.8/ 100
METRIC RATING
104th/ 347
METRIC RANK
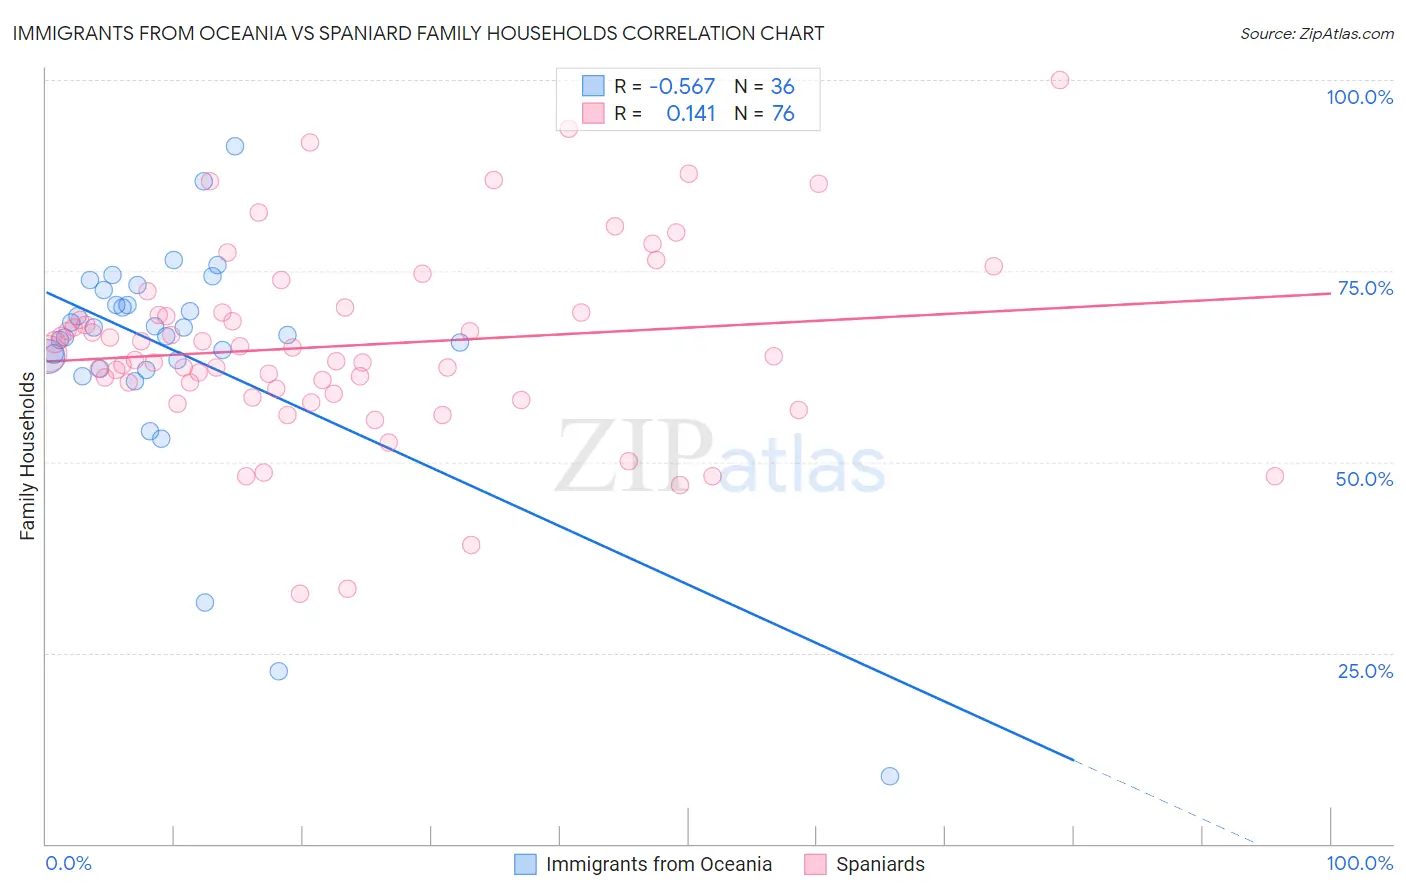
Immigrants from Oceania vs Spaniard Family Households Correlation Chart
The statistical analysis conducted on geographies consisting of 305,389,085 people shows a substantial negative correlation between the proportion of Immigrants from Oceania and percentage of family households in the United States with a correlation coefficient (R) of -0.567 and weighted average of 64.9%. Similarly, the statistical analysis conducted on geographies consisting of 443,170,610 people shows a poor positive correlation between the proportion of Spaniards and percentage of family households in the United States with a correlation coefficient (R) of 0.141 and weighted average of 65.1%, a difference of 0.34%.
Family Households Correlation Summary
| Measurement | Immigrants from Oceania | Spaniard |
| Minimum | 8.8% | 32.8% |
| Maximum | 91.4% | 100.0% |
| Range | 82.6% | 67.2% |
| Mean | 64.5% | 65.2% |
| Median | 67.1% | 64.1% |
| Interquartile 25% (IQ1) | 62.7% | 59.3% |
| Interquartile 75% (IQ3) | 71.6% | 69.6% |
| Interquartile Range (IQR) | 8.8% | 10.3% |
| Standard Deviation (Sample) | 15.4% | 12.5% |
| Standard Deviation (Population) | 15.2% | 12.4% |
Demographics Similar to Immigrants from Oceania and Spaniards by Family Households
In terms of family households, the demographic groups most similar to Immigrants from Oceania are Immigrants from Eastern Asia (64.9%, a difference of 0.010%), Hungarian (64.9%, a difference of 0.010%), Hmong (64.9%, a difference of 0.050%), Dutch (64.9%, a difference of 0.060%), and Ecuadorian (65.0%, a difference of 0.080%). Similarly, the demographic groups most similar to Spaniards are Indian (Asian) (65.1%, a difference of 0.010%), Immigrants from Sri Lanka (65.1%, a difference of 0.020%), English (65.1%, a difference of 0.070%), White/Caucasian (65.1%, a difference of 0.070%), and Alaska Native (65.1%, a difference of 0.070%).
| Demographics | Rating | Rank | Family Households |
| Immigrants | Sri Lanka | 98.0 /100 | #102 | Exceptional 65.1% |
| Indians (Asian) | 97.9 /100 | #103 | Exceptional 65.1% |
| Spaniards | 97.8 /100 | #104 | Exceptional 65.1% |
| English | 97.4 /100 | #105 | Exceptional 65.1% |
| Whites/Caucasians | 97.3 /100 | #106 | Exceptional 65.1% |
| Alaska Natives | 97.3 /100 | #107 | Exceptional 65.1% |
| Palestinians | 97.2 /100 | #108 | Exceptional 65.1% |
| Immigrants | Guatemala | 96.9 /100 | #109 | Exceptional 65.0% |
| Scandinavians | 96.8 /100 | #110 | Exceptional 65.0% |
| Europeans | 96.8 /100 | #111 | Exceptional 65.0% |
| Immigrants | Jordan | 96.5 /100 | #112 | Exceptional 65.0% |
| Spanish | 96.2 /100 | #113 | Exceptional 65.0% |
| Argentineans | 95.7 /100 | #114 | Exceptional 65.0% |
| Ecuadorians | 95.4 /100 | #115 | Exceptional 65.0% |
| Immigrants | Iraq | 95.4 /100 | #116 | Exceptional 65.0% |
| Cherokee | 95.3 /100 | #117 | Exceptional 65.0% |
| Dutch | 95.1 /100 | #118 | Exceptional 64.9% |
| Immigrants | Eastern Asia | 94.4 /100 | #119 | Exceptional 64.9% |
| Immigrants | Oceania | 94.2 /100 | #120 | Exceptional 64.9% |
| Hungarians | 94.0 /100 | #121 | Exceptional 64.9% |
| Hmong | 93.4 /100 | #122 | Exceptional 64.9% |