Immigrants from Oceania vs Immigrants from Jamaica Family Households
COMPARE
Immigrants from Oceania
Immigrants from Jamaica
Family Households
Family Households Comparison
Immigrants from Oceania
Immigrants from Jamaica
64.9%
FAMILY HOUSEHOLDS
94.2/ 100
METRIC RATING
120th/ 347
METRIC RANK
64.7%
FAMILY HOUSEHOLDS
85.3/ 100
METRIC RATING
139th/ 347
METRIC RANK
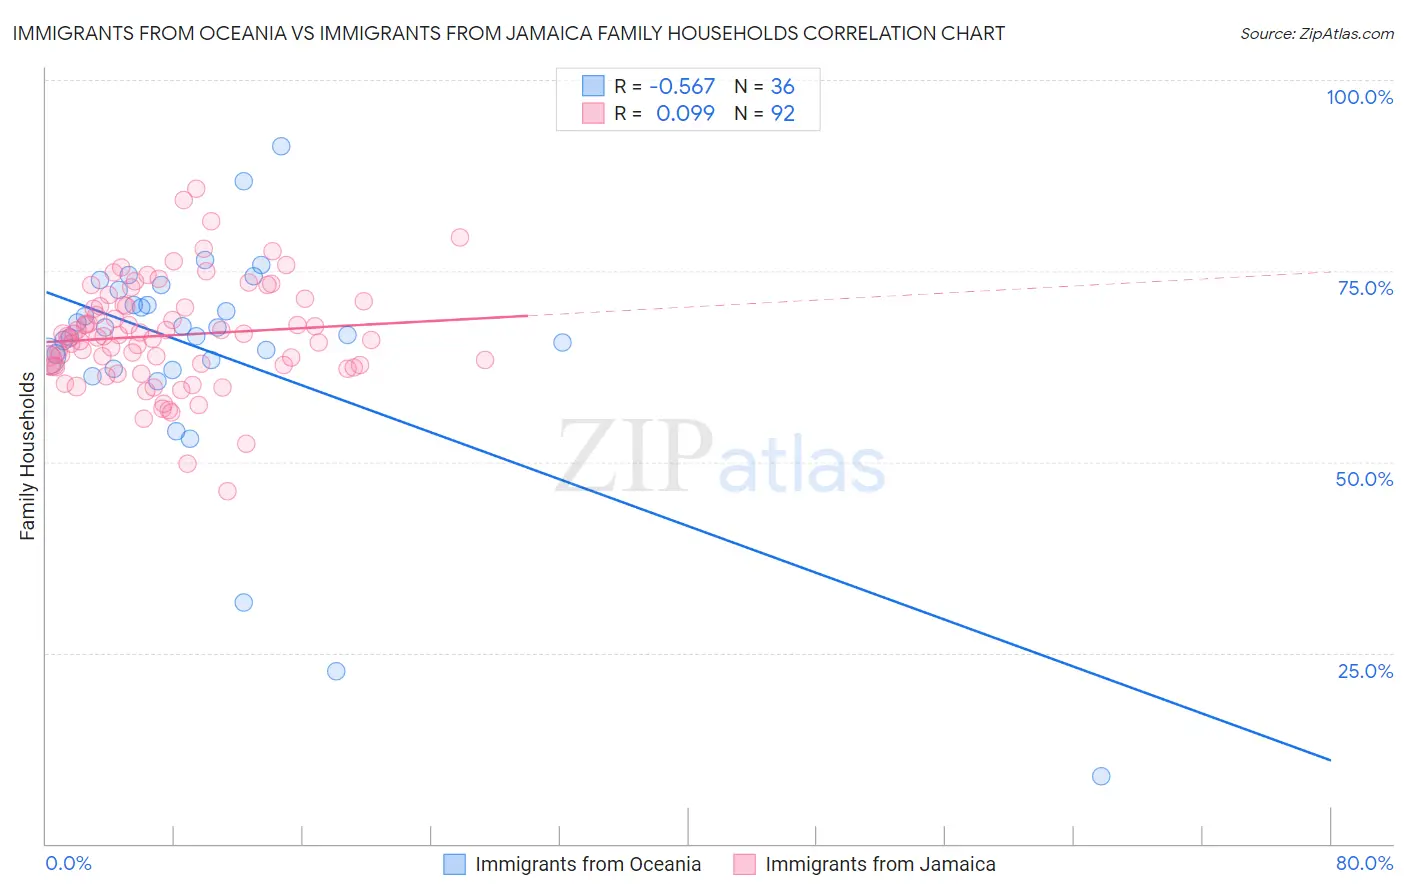
Immigrants from Oceania vs Immigrants from Jamaica Family Households Correlation Chart
The statistical analysis conducted on geographies consisting of 305,389,085 people shows a substantial negative correlation between the proportion of Immigrants from Oceania and percentage of family households in the United States with a correlation coefficient (R) of -0.567 and weighted average of 64.9%. Similarly, the statistical analysis conducted on geographies consisting of 301,592,909 people shows a slight positive correlation between the proportion of Immigrants from Jamaica and percentage of family households in the United States with a correlation coefficient (R) of 0.099 and weighted average of 64.7%, a difference of 0.34%.
Family Households Correlation Summary
| Measurement | Immigrants from Oceania | Immigrants from Jamaica |
| Minimum | 8.8% | 46.2% |
| Maximum | 91.4% | 85.7% |
| Range | 82.6% | 39.5% |
| Mean | 64.5% | 66.6% |
| Median | 67.1% | 66.4% |
| Interquartile 25% (IQ1) | 62.7% | 62.6% |
| Interquartile 75% (IQ3) | 71.6% | 70.5% |
| Interquartile Range (IQR) | 8.8% | 7.9% |
| Standard Deviation (Sample) | 15.4% | 6.9% |
| Standard Deviation (Population) | 15.2% | 6.9% |
Demographics Similar to Immigrants from Oceania and Immigrants from Jamaica by Family Households
In terms of family households, the demographic groups most similar to Immigrants from Oceania are Immigrants from Eastern Asia (64.9%, a difference of 0.010%), Hungarian (64.9%, a difference of 0.010%), Hmong (64.9%, a difference of 0.050%), Choctaw (64.9%, a difference of 0.050%), and Immigrants from Argentina (64.9%, a difference of 0.080%). Similarly, the demographic groups most similar to Immigrants from Jamaica are Basque (64.7%, a difference of 0.010%), Immigrants from China (64.7%, a difference of 0.030%), Immigrants from Scotland (64.7%, a difference of 0.030%), Maltese (64.7%, a difference of 0.060%), and Greek (64.7%, a difference of 0.080%).
| Demographics | Rating | Rank | Family Households |
| Immigrants | Eastern Asia | 94.4 /100 | #119 | Exceptional 64.9% |
| Immigrants | Oceania | 94.2 /100 | #120 | Exceptional 64.9% |
| Hungarians | 94.0 /100 | #121 | Exceptional 64.9% |
| Hmong | 93.4 /100 | #122 | Exceptional 64.9% |
| Choctaw | 93.4 /100 | #123 | Exceptional 64.9% |
| Immigrants | Argentina | 92.8 /100 | #124 | Exceptional 64.9% |
| Immigrants | Belize | 92.7 /100 | #125 | Exceptional 64.9% |
| Panamanians | 92.4 /100 | #126 | Exceptional 64.8% |
| Immigrants | Panama | 92.0 /100 | #127 | Exceptional 64.8% |
| Italians | 91.9 /100 | #128 | Exceptional 64.8% |
| Immigrants | Ecuador | 91.4 /100 | #129 | Exceptional 64.8% |
| Immigrants | Italy | 90.2 /100 | #130 | Exceptional 64.8% |
| Immigrants | Nonimmigrants | 90.1 /100 | #131 | Exceptional 64.8% |
| Cajuns | 89.4 /100 | #132 | Excellent 64.8% |
| Belizeans | 89.3 /100 | #133 | Excellent 64.8% |
| Greeks | 88.1 /100 | #134 | Excellent 64.7% |
| Maltese | 87.4 /100 | #135 | Excellent 64.7% |
| Immigrants | China | 86.6 /100 | #136 | Excellent 64.7% |
| Immigrants | Scotland | 86.4 /100 | #137 | Excellent 64.7% |
| Basques | 85.5 /100 | #138 | Excellent 64.7% |
| Immigrants | Jamaica | 85.3 /100 | #139 | Excellent 64.7% |