Immigrants from Senegal vs Paiute Family Households
COMPARE
Immigrants from Senegal
Paiute
Family Households
Family Households Comparison
Immigrants from Senegal
Paiute
60.1%
FAMILY HOUSEHOLDS
0.0/ 100
METRIC RATING
341st/ 347
METRIC RANK
64.0%
FAMILY HOUSEHOLDS
22.2/ 100
METRIC RATING
194th/ 347
METRIC RANK
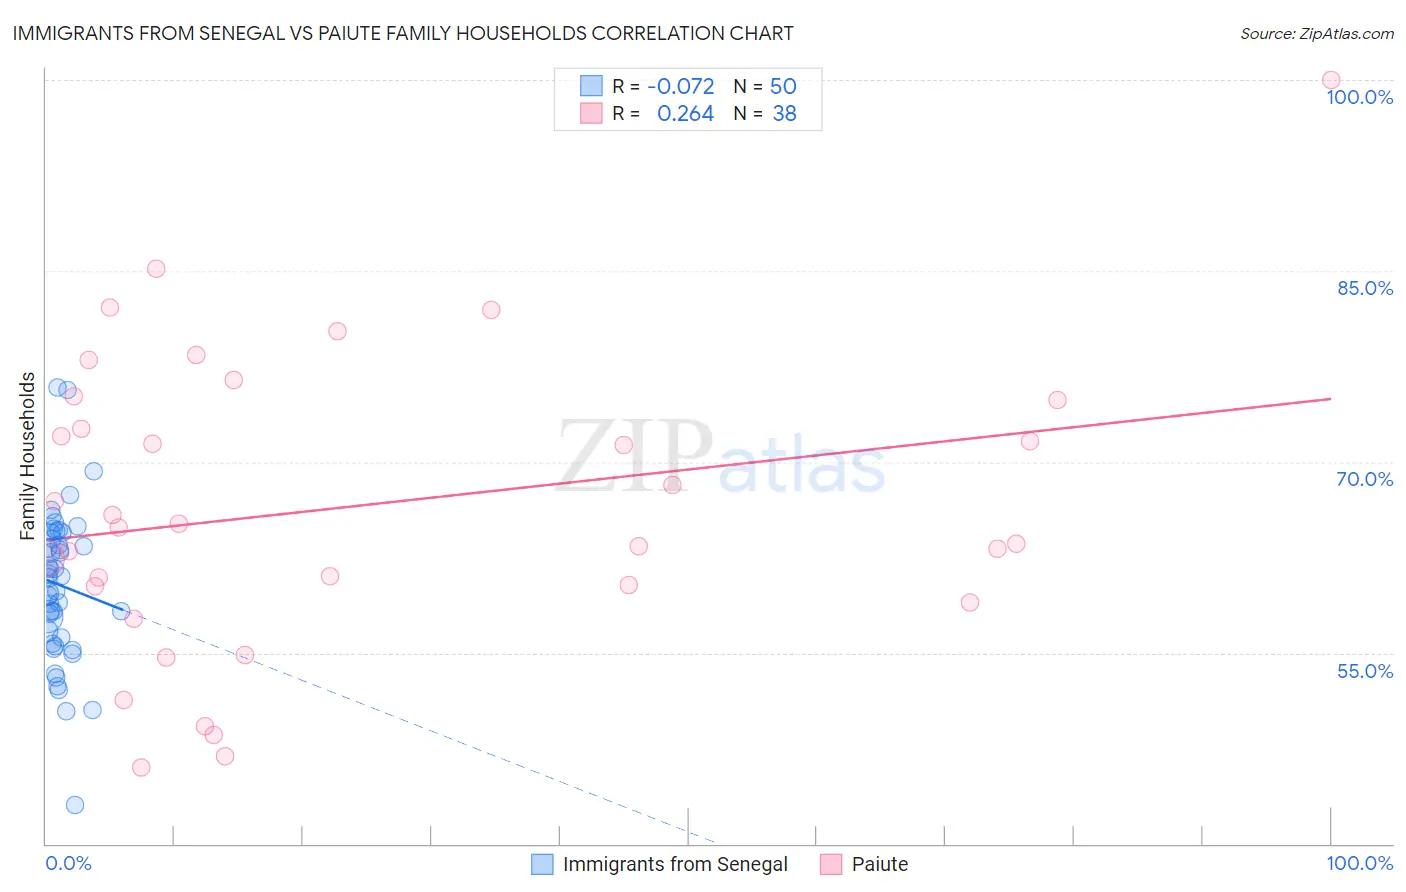
Immigrants from Senegal vs Paiute Family Households Correlation Chart
The statistical analysis conducted on geographies consisting of 90,120,671 people shows a slight negative correlation between the proportion of Immigrants from Senegal and percentage of family households in the United States with a correlation coefficient (R) of -0.072 and weighted average of 60.1%. Similarly, the statistical analysis conducted on geographies consisting of 58,392,138 people shows a weak positive correlation between the proportion of Paiute and percentage of family households in the United States with a correlation coefficient (R) of 0.264 and weighted average of 64.0%, a difference of 6.5%.
Family Households Correlation Summary
| Measurement | Immigrants from Senegal | Paiute |
| Minimum | 43.0% | 46.0% |
| Maximum | 75.9% | 100.0% |
| Range | 32.9% | 54.0% |
| Mean | 60.3% | 66.5% |
| Median | 61.0% | 65.0% |
| Interquartile 25% (IQ1) | 56.2% | 60.2% |
| Interquartile 75% (IQ3) | 64.4% | 74.8% |
| Interquartile Range (IQR) | 8.2% | 14.6% |
| Standard Deviation (Sample) | 6.0% | 11.7% |
| Standard Deviation (Population) | 6.0% | 11.6% |
Similar Demographics by Family Households
Demographics Similar to Immigrants from Senegal by Family Households
In terms of family households, the demographic groups most similar to Immigrants from Senegal are Immigrants from Sudan (60.2%, a difference of 0.080%), Sudanese (60.0%, a difference of 0.18%), Senegalese (59.8%, a difference of 0.48%), Immigrants from Saudi Arabia (60.7%, a difference of 0.98%), and Immigrants from Eritrea (60.8%, a difference of 1.2%).
| Demographics | Rating | Rank | Family Households |
| Immigrants | Ethiopia | 0.0 /100 | #333 | Tragic 61.2% |
| Immigrants | Eastern Africa | 0.0 /100 | #334 | Tragic 61.1% |
| Carpatho Rusyns | 0.0 /100 | #335 | Tragic 61.1% |
| German Russians | 0.0 /100 | #336 | Tragic 60.9% |
| Soviet Union | 0.0 /100 | #337 | Tragic 60.9% |
| Immigrants | Eritrea | 0.0 /100 | #338 | Tragic 60.8% |
| Immigrants | Saudi Arabia | 0.0 /100 | #339 | Tragic 60.7% |
| Immigrants | Sudan | 0.0 /100 | #340 | Tragic 60.2% |
| Immigrants | Senegal | 0.0 /100 | #341 | Tragic 60.1% |
| Sudanese | 0.0 /100 | #342 | Tragic 60.0% |
| Senegalese | 0.0 /100 | #343 | Tragic 59.8% |
| Immigrants | Congo | 0.0 /100 | #344 | Tragic 59.2% |
| Immigrants | Zaire | 0.0 /100 | #345 | Tragic 59.2% |
| Somalis | 0.0 /100 | #346 | Tragic 57.6% |
| Immigrants | Somalia | 0.0 /100 | #347 | Tragic 56.7% |
Demographics Similar to Paiute by Family Households
In terms of family households, the demographic groups most similar to Paiute are Lithuanian (64.0%, a difference of 0.030%), French (64.0%, a difference of 0.030%), Arab (64.1%, a difference of 0.040%), Immigrants from North America (64.0%, a difference of 0.040%), and Zimbabwean (64.1%, a difference of 0.050%).
| Demographics | Rating | Rank | Family Households |
| Northern Europeans | 28.2 /100 | #187 | Fair 64.1% |
| Paraguayans | 26.7 /100 | #188 | Fair 64.1% |
| Immigrants | Western Asia | 25.3 /100 | #189 | Fair 64.1% |
| Zimbabweans | 24.7 /100 | #190 | Fair 64.1% |
| Arabs | 24.5 /100 | #191 | Fair 64.1% |
| Lithuanians | 23.8 /100 | #192 | Fair 64.0% |
| French | 23.7 /100 | #193 | Fair 64.0% |
| Paiute | 22.2 /100 | #194 | Fair 64.0% |
| Immigrants | North America | 20.0 /100 | #195 | Poor 64.0% |
| Immigrants | Canada | 19.2 /100 | #196 | Poor 64.0% |
| Seminole | 18.9 /100 | #197 | Poor 64.0% |
| Poles | 18.9 /100 | #198 | Poor 64.0% |
| Slavs | 18.6 /100 | #199 | Poor 64.0% |
| Immigrants | Malaysia | 17.9 /100 | #200 | Poor 64.0% |
| Immigrants | Eastern Europe | 17.2 /100 | #201 | Poor 64.0% |