Immigrants from Norway vs Yuman Married-couple Households
COMPARE
Immigrants from Norway
Yuman
Married-couple Households
Married-couple Households Comparison
Immigrants from Norway
Yuman
46.5%
MARRIED-COUPLE HOUSEHOLDS
52.0/ 100
METRIC RATING
173rd/ 347
METRIC RANK
43.3%
MARRIED-COUPLE HOUSEHOLDS
0.1/ 100
METRIC RATING
270th/ 347
METRIC RANK
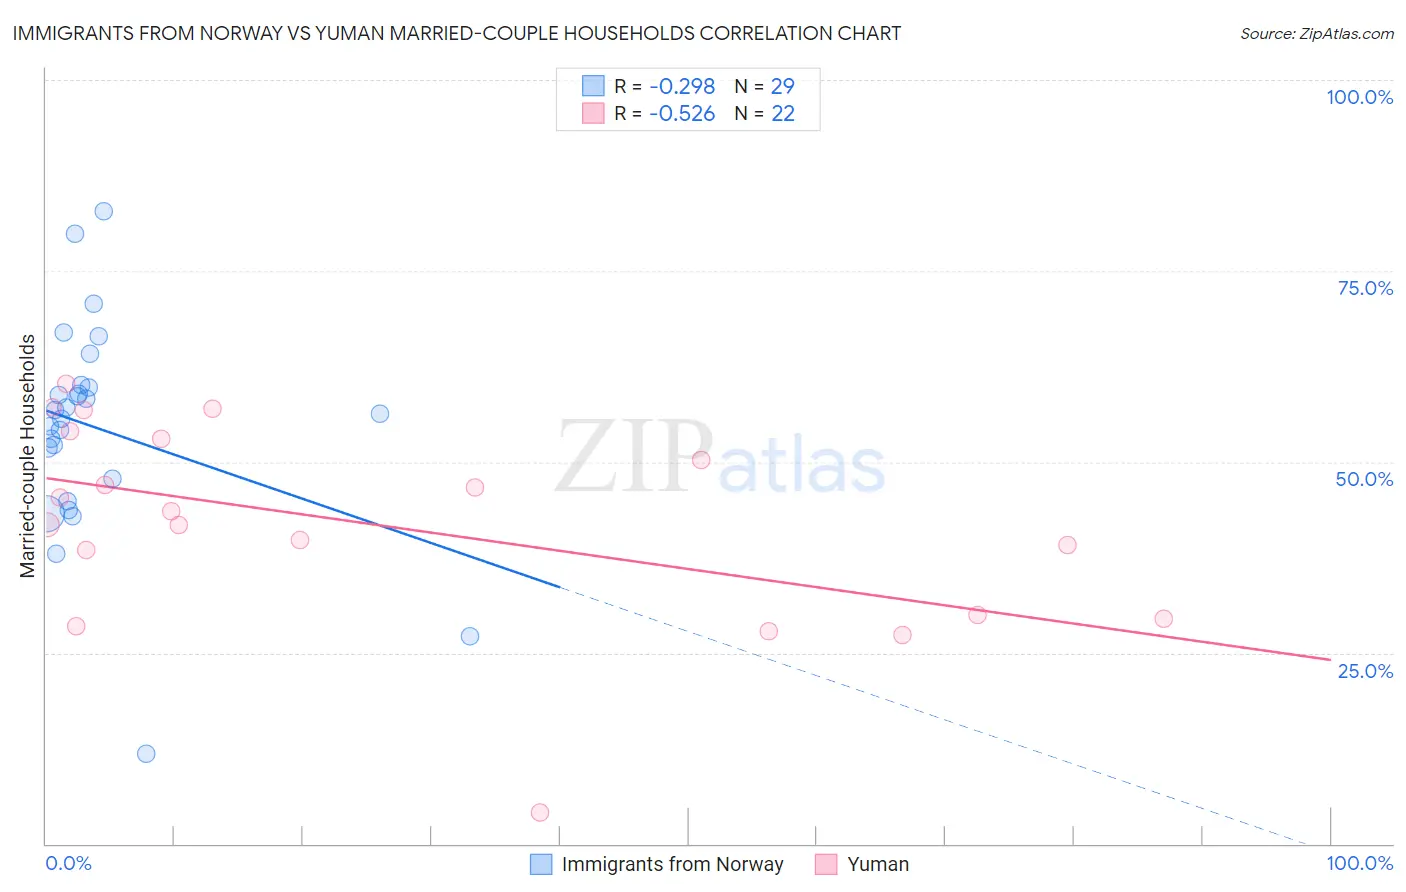
Immigrants from Norway vs Yuman Married-couple Households Correlation Chart
The statistical analysis conducted on geographies consisting of 116,686,104 people shows a weak negative correlation between the proportion of Immigrants from Norway and percentage of married-couple family households in the United States with a correlation coefficient (R) of -0.298 and weighted average of 46.5%. Similarly, the statistical analysis conducted on geographies consisting of 40,663,496 people shows a substantial negative correlation between the proportion of Yuman and percentage of married-couple family households in the United States with a correlation coefficient (R) of -0.526 and weighted average of 43.3%, a difference of 7.3%.
Married-couple Households Correlation Summary
| Measurement | Immigrants from Norway | Yuman |
| Minimum | 11.8% | 4.1% |
| Maximum | 82.8% | 60.2% |
| Range | 71.0% | 56.2% |
| Mean | 54.3% | 41.8% |
| Median | 56.2% | 42.7% |
| Interquartile 25% (IQ1) | 46.3% | 30.0% |
| Interquartile 75% (IQ3) | 59.8% | 53.1% |
| Interquartile Range (IQR) | 13.6% | 23.0% |
| Standard Deviation (Sample) | 14.2% | 13.4% |
| Standard Deviation (Population) | 13.9% | 13.1% |
Similar Demographics by Married-couple Households
Demographics Similar to Immigrants from Norway by Married-couple Households
In terms of married-couple households, the demographic groups most similar to Immigrants from Norway are Immigrants from Mexico (46.4%, a difference of 0.070%), Immigrants from Australia (46.5%, a difference of 0.10%), Immigrants from Chile (46.5%, a difference of 0.14%), Immigrants from Colombia (46.4%, a difference of 0.22%), and South American (46.6%, a difference of 0.23%).
| Demographics | Rating | Rank | Married-couple Households |
| Cherokee | 65.7 /100 | #166 | Good 46.7% |
| Immigrants | Croatia | 64.2 /100 | #167 | Good 46.7% |
| Israelis | 62.3 /100 | #168 | Good 46.7% |
| Spanish American Indians | 59.4 /100 | #169 | Average 46.6% |
| South Americans | 58.0 /100 | #170 | Average 46.6% |
| Immigrants | Chile | 55.7 /100 | #171 | Average 46.5% |
| Immigrants | Australia | 54.6 /100 | #172 | Average 46.5% |
| Immigrants | Norway | 52.0 /100 | #173 | Average 46.5% |
| Immigrants | Mexico | 50.0 /100 | #174 | Average 46.4% |
| Immigrants | Colombia | 46.1 /100 | #175 | Average 46.4% |
| Cajuns | 45.2 /100 | #176 | Average 46.4% |
| Immigrants | Immigrants | 43.8 /100 | #177 | Average 46.3% |
| Immigrants | Costa Rica | 43.4 /100 | #178 | Average 46.3% |
| Immigrants | Zimbabwe | 43.0 /100 | #179 | Average 46.3% |
| Mongolians | 42.0 /100 | #180 | Average 46.3% |
Demographics Similar to Yuman by Married-couple Households
In terms of married-couple households, the demographic groups most similar to Yuman are Immigrants from Sierra Leone (43.3%, a difference of 0.050%), Guatemalan (43.3%, a difference of 0.11%), Immigrants from Nigeria (43.2%, a difference of 0.21%), Immigrants from Burma/Myanmar (43.4%, a difference of 0.25%), and Ethiopian (43.2%, a difference of 0.31%).
| Demographics | Rating | Rank | Married-couple Households |
| Cree | 0.1 /100 | #263 | Tragic 43.6% |
| Bangladeshis | 0.1 /100 | #264 | Tragic 43.5% |
| Moroccans | 0.1 /100 | #265 | Tragic 43.5% |
| Ecuadorians | 0.1 /100 | #266 | Tragic 43.5% |
| Natives/Alaskans | 0.1 /100 | #267 | Tragic 43.5% |
| Immigrants | Burma/Myanmar | 0.1 /100 | #268 | Tragic 43.4% |
| Immigrants | Sierra Leone | 0.1 /100 | #269 | Tragic 43.3% |
| Yuman | 0.1 /100 | #270 | Tragic 43.3% |
| Guatemalans | 0.1 /100 | #271 | Tragic 43.3% |
| Immigrants | Nigeria | 0.1 /100 | #272 | Tragic 43.2% |
| Ethiopians | 0.1 /100 | #273 | Tragic 43.2% |
| Nigerians | 0.1 /100 | #274 | Tragic 43.2% |
| Immigrants | Bangladesh | 0.0 /100 | #275 | Tragic 43.1% |
| Immigrants | Ethiopia | 0.0 /100 | #276 | Tragic 43.1% |
| Immigrants | Eastern Africa | 0.0 /100 | #277 | Tragic 42.9% |