Immigrants from Norway vs Bolivian Married-couple Households
COMPARE
Immigrants from Norway
Bolivian
Married-couple Households
Married-couple Households Comparison
Immigrants from Norway
Bolivians
46.5%
MARRIED-COUPLE HOUSEHOLDS
52.0/ 100
METRIC RATING
173rd/ 347
METRIC RANK
49.2%
MARRIED-COUPLE HOUSEHOLDS
99.8/ 100
METRIC RATING
30th/ 347
METRIC RANK
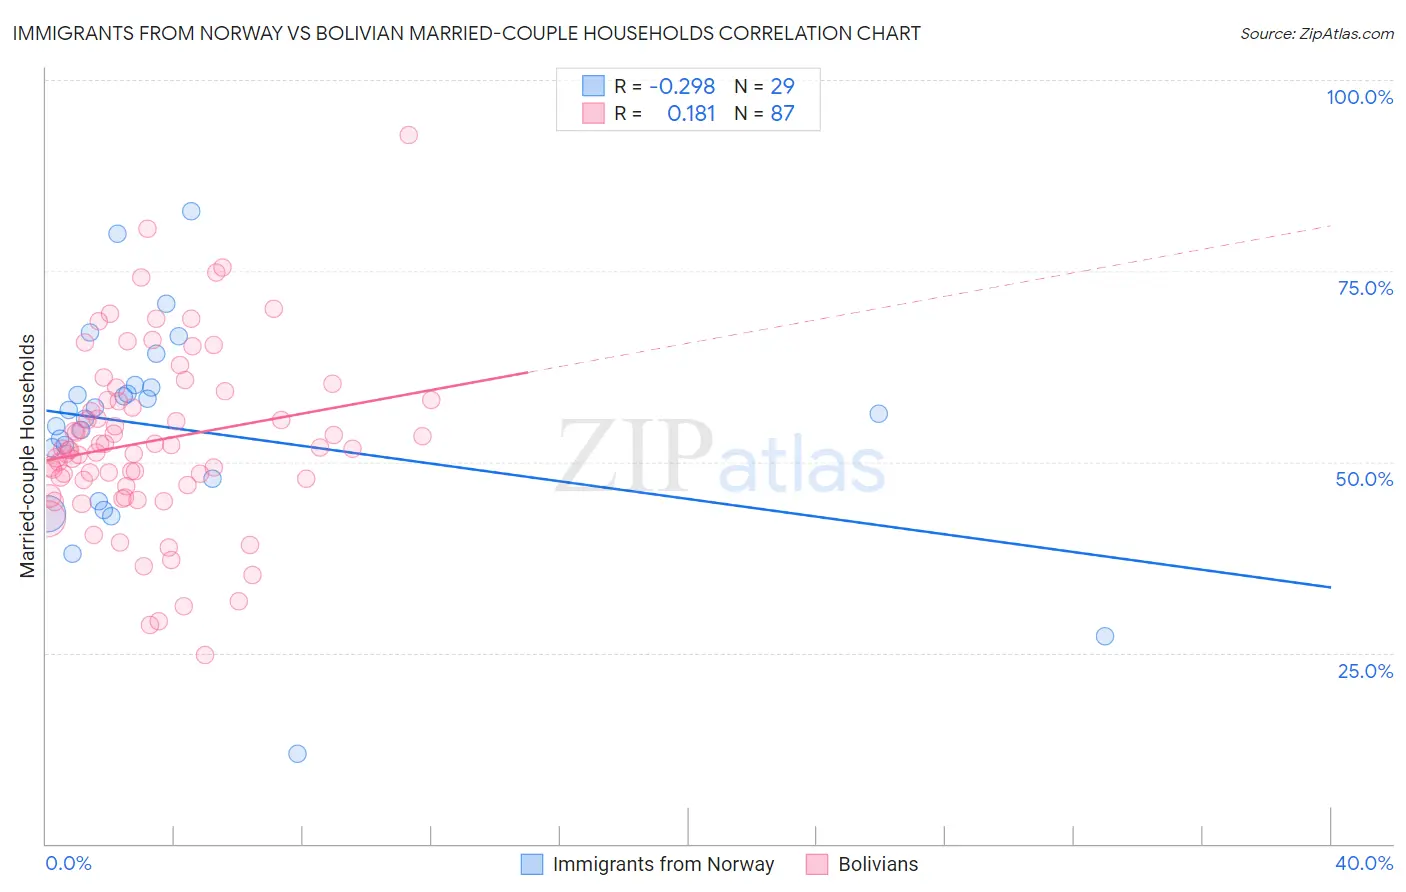
Immigrants from Norway vs Bolivian Married-couple Households Correlation Chart
The statistical analysis conducted on geographies consisting of 116,686,104 people shows a weak negative correlation between the proportion of Immigrants from Norway and percentage of married-couple family households in the United States with a correlation coefficient (R) of -0.298 and weighted average of 46.5%. Similarly, the statistical analysis conducted on geographies consisting of 184,628,084 people shows a poor positive correlation between the proportion of Bolivians and percentage of married-couple family households in the United States with a correlation coefficient (R) of 0.181 and weighted average of 49.2%, a difference of 5.8%.
Married-couple Households Correlation Summary
| Measurement | Immigrants from Norway | Bolivian |
| Minimum | 11.8% | 24.7% |
| Maximum | 82.8% | 92.8% |
| Range | 71.0% | 68.0% |
| Mean | 54.3% | 52.8% |
| Median | 56.2% | 51.7% |
| Interquartile 25% (IQ1) | 46.3% | 47.0% |
| Interquartile 75% (IQ3) | 59.8% | 58.2% |
| Interquartile Range (IQR) | 13.6% | 11.1% |
| Standard Deviation (Sample) | 14.2% | 11.7% |
| Standard Deviation (Population) | 13.9% | 11.6% |
Similar Demographics by Married-couple Households
Demographics Similar to Immigrants from Norway by Married-couple Households
In terms of married-couple households, the demographic groups most similar to Immigrants from Norway are Immigrants from Mexico (46.4%, a difference of 0.070%), Immigrants from Australia (46.5%, a difference of 0.10%), Immigrants from Chile (46.5%, a difference of 0.14%), Immigrants from Colombia (46.4%, a difference of 0.22%), and South American (46.6%, a difference of 0.23%).
| Demographics | Rating | Rank | Married-couple Households |
| Cherokee | 65.7 /100 | #166 | Good 46.7% |
| Immigrants | Croatia | 64.2 /100 | #167 | Good 46.7% |
| Israelis | 62.3 /100 | #168 | Good 46.7% |
| Spanish American Indians | 59.4 /100 | #169 | Average 46.6% |
| South Americans | 58.0 /100 | #170 | Average 46.6% |
| Immigrants | Chile | 55.7 /100 | #171 | Average 46.5% |
| Immigrants | Australia | 54.6 /100 | #172 | Average 46.5% |
| Immigrants | Norway | 52.0 /100 | #173 | Average 46.5% |
| Immigrants | Mexico | 50.0 /100 | #174 | Average 46.4% |
| Immigrants | Colombia | 46.1 /100 | #175 | Average 46.4% |
| Cajuns | 45.2 /100 | #176 | Average 46.4% |
| Immigrants | Immigrants | 43.8 /100 | #177 | Average 46.3% |
| Immigrants | Costa Rica | 43.4 /100 | #178 | Average 46.3% |
| Immigrants | Zimbabwe | 43.0 /100 | #179 | Average 46.3% |
| Mongolians | 42.0 /100 | #180 | Average 46.3% |
Demographics Similar to Bolivians by Married-couple Households
In terms of married-couple households, the demographic groups most similar to Bolivians are German (49.2%, a difference of 0.020%), Maltese (49.2%, a difference of 0.020%), Native Hawaiian (49.1%, a difference of 0.11%), Hungarian (49.1%, a difference of 0.17%), and Immigrants from Asia (49.1%, a difference of 0.20%).
| Demographics | Rating | Rank | Married-couple Households |
| Dutch | 99.9 /100 | #23 | Exceptional 49.5% |
| Czechs | 99.9 /100 | #24 | Exceptional 49.4% |
| Immigrants | Philippines | 99.9 /100 | #25 | Exceptional 49.3% |
| Immigrants | Scotland | 99.8 /100 | #26 | Exceptional 49.3% |
| Bhutanese | 99.8 /100 | #27 | Exceptional 49.3% |
| Germans | 99.8 /100 | #28 | Exceptional 49.2% |
| Maltese | 99.8 /100 | #29 | Exceptional 49.2% |
| Bolivians | 99.8 /100 | #30 | Exceptional 49.2% |
| Native Hawaiians | 99.8 /100 | #31 | Exceptional 49.1% |
| Hungarians | 99.8 /100 | #32 | Exceptional 49.1% |
| Immigrants | Asia | 99.7 /100 | #33 | Exceptional 49.1% |
| Italians | 99.7 /100 | #34 | Exceptional 49.0% |
| Scottish | 99.7 /100 | #35 | Exceptional 49.0% |
| Iranians | 99.7 /100 | #36 | Exceptional 49.0% |
| Sri Lankans | 99.7 /100 | #37 | Exceptional 49.0% |