Immigrants from Norway vs Bolivian Median Male Earnings
COMPARE
Immigrants from Norway
Bolivian
Median Male Earnings
Median Male Earnings Comparison
Immigrants from Norway
Bolivians
$61,628
MEDIAN MALE EARNINGS
99.9/ 100
METRIC RATING
52nd/ 347
METRIC RANK
$61,066
MEDIAN MALE EARNINGS
99.8/ 100
METRIC RATING
61st/ 347
METRIC RANK
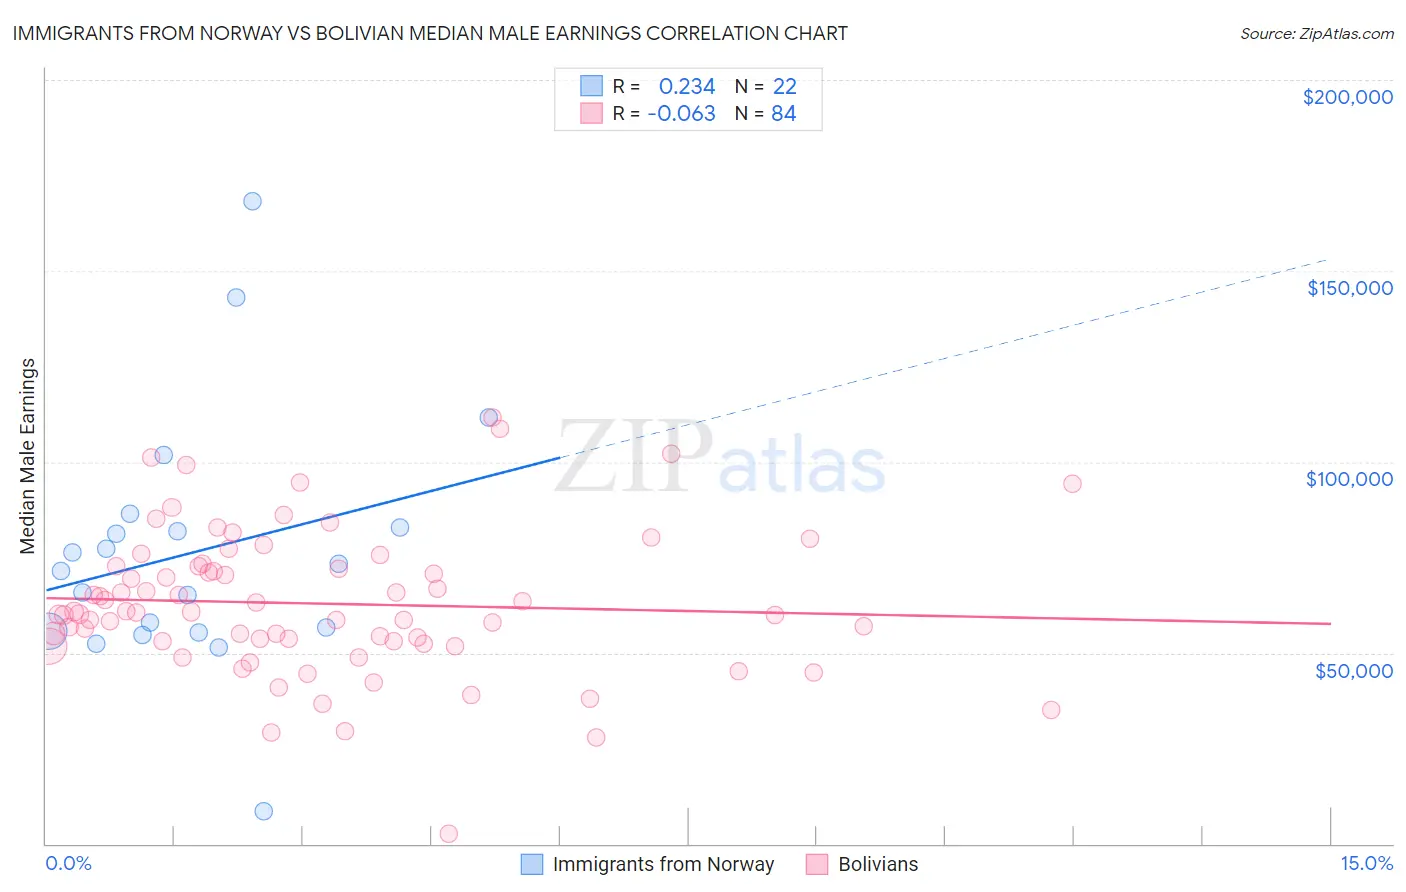
Immigrants from Norway vs Bolivian Median Male Earnings Correlation Chart
The statistical analysis conducted on geographies consisting of 116,702,945 people shows a weak positive correlation between the proportion of Immigrants from Norway and median male earnings in the United States with a correlation coefficient (R) of 0.234 and weighted average of $61,628. Similarly, the statistical analysis conducted on geographies consisting of 184,669,287 people shows a slight negative correlation between the proportion of Bolivians and median male earnings in the United States with a correlation coefficient (R) of -0.063 and weighted average of $61,066, a difference of 0.92%.
Median Male Earnings Correlation Summary
| Measurement | Immigrants from Norway | Bolivian |
| Minimum | $8,547 | $2,499 |
| Maximum | $168,268 | $111,480 |
| Range | $159,721 | $108,981 |
| Mean | $76,311 | $62,895 |
| Median | $72,426 | $60,590 |
| Interquartile 25% (IQ1) | $55,593 | $53,011 |
| Interquartile 75% (IQ3) | $82,963 | $72,615 |
| Interquartile Range (IQR) | $27,370 | $19,604 |
| Standard Deviation (Sample) | $33,202 | $18,921 |
| Standard Deviation (Population) | $32,439 | $18,808 |
Demographics Similar to Immigrants from Norway and Bolivians by Median Male Earnings
In terms of median male earnings, the demographic groups most similar to Immigrants from Norway are Estonian ($61,710, a difference of 0.13%), Bhutanese ($61,759, a difference of 0.21%), South African ($61,460, a difference of 0.27%), Immigrants from Latvia ($61,422, a difference of 0.34%), and Greek ($61,242, a difference of 0.63%). Similarly, the demographic groups most similar to Bolivians are Immigrants from Romania ($61,040, a difference of 0.040%), Immigrants from Netherlands ($61,096, a difference of 0.050%), Egyptian ($61,095, a difference of 0.050%), Immigrants from Pakistan ($60,987, a difference of 0.13%), and Immigrants from Eastern Europe ($60,958, a difference of 0.18%).
| Demographics | Rating | Rank | Median Male Earnings |
| Immigrants | Czechoslovakia | 99.9 /100 | #46 | Exceptional $62,217 |
| Immigrants | Austria | 99.9 /100 | #47 | Exceptional $62,164 |
| Immigrants | Malaysia | 99.9 /100 | #48 | Exceptional $62,121 |
| Immigrants | Europe | 99.9 /100 | #49 | Exceptional $62,057 |
| Bhutanese | 99.9 /100 | #50 | Exceptional $61,759 |
| Estonians | 99.9 /100 | #51 | Exceptional $61,710 |
| Immigrants | Norway | 99.9 /100 | #52 | Exceptional $61,628 |
| South Africans | 99.9 /100 | #53 | Exceptional $61,460 |
| Immigrants | Latvia | 99.9 /100 | #54 | Exceptional $61,422 |
| Greeks | 99.9 /100 | #55 | Exceptional $61,242 |
| Lithuanians | 99.9 /100 | #56 | Exceptional $61,228 |
| Immigrants | Scotland | 99.9 /100 | #57 | Exceptional $61,220 |
| New Zealanders | 99.9 /100 | #58 | Exceptional $61,199 |
| Immigrants | Netherlands | 99.8 /100 | #59 | Exceptional $61,096 |
| Egyptians | 99.8 /100 | #60 | Exceptional $61,095 |
| Bolivians | 99.8 /100 | #61 | Exceptional $61,066 |
| Immigrants | Romania | 99.8 /100 | #62 | Exceptional $61,040 |
| Immigrants | Pakistan | 99.8 /100 | #63 | Exceptional $60,987 |
| Immigrants | Eastern Europe | 99.8 /100 | #64 | Exceptional $60,958 |
| Immigrants | Indonesia | 99.8 /100 | #65 | Exceptional $60,935 |
| Immigrants | Croatia | 99.8 /100 | #66 | Exceptional $60,914 |