Immigrants from North Macedonia vs Greek Married-couple Households
COMPARE
Immigrants from North Macedonia
Greek
Married-couple Households
Married-couple Households Comparison
Immigrants from North Macedonia
Greeks
47.9%
MARRIED-COUPLE HOUSEHOLDS
96.4/ 100
METRIC RATING
98th/ 347
METRIC RANK
48.9%
MARRIED-COUPLE HOUSEHOLDS
99.7/ 100
METRIC RATING
38th/ 347
METRIC RANK
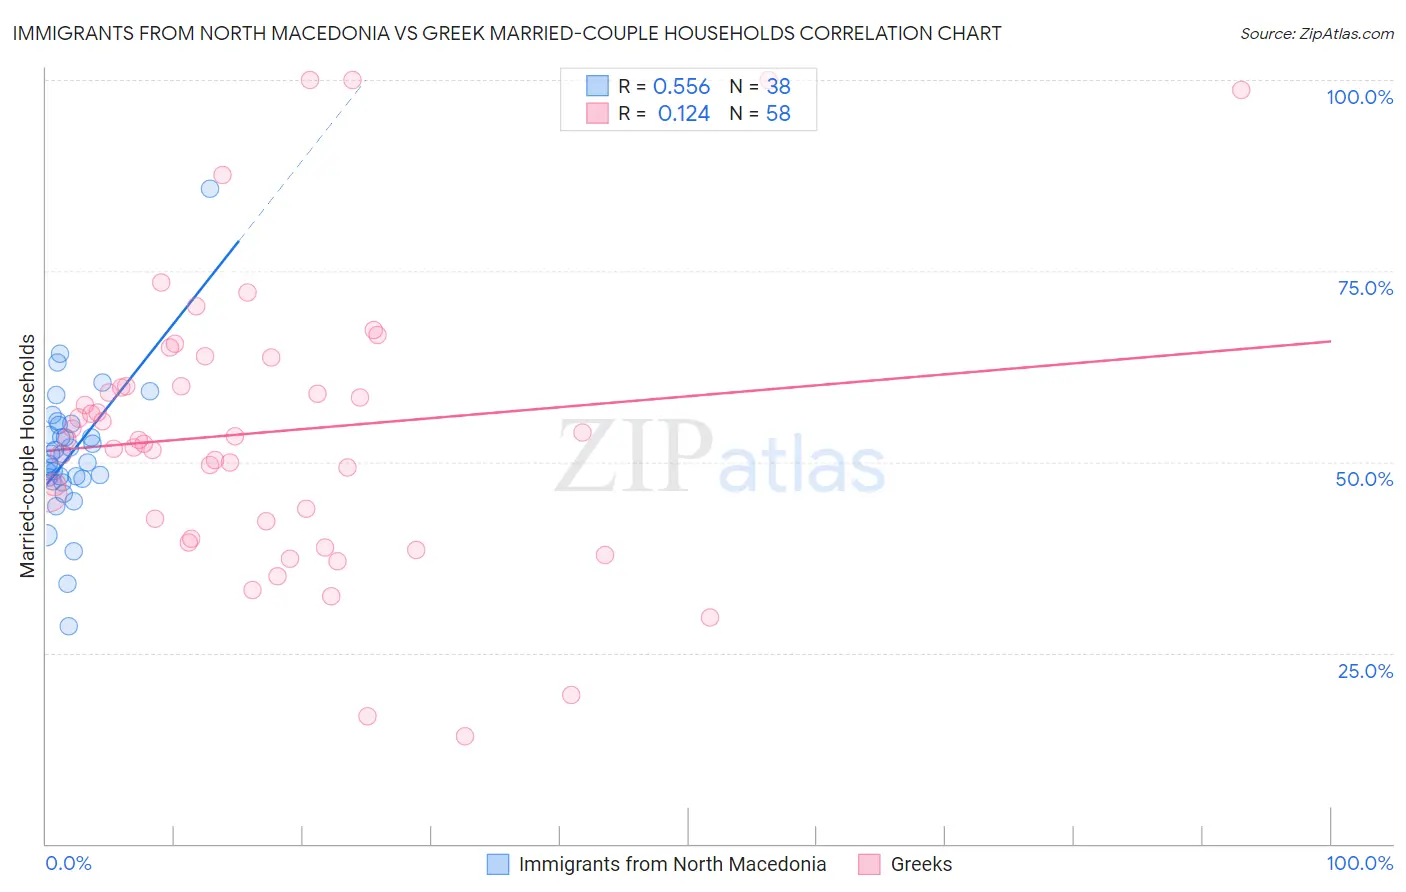
Immigrants from North Macedonia vs Greek Married-couple Households Correlation Chart
The statistical analysis conducted on geographies consisting of 74,300,796 people shows a substantial positive correlation between the proportion of Immigrants from North Macedonia and percentage of married-couple family households in the United States with a correlation coefficient (R) of 0.556 and weighted average of 47.9%. Similarly, the statistical analysis conducted on geographies consisting of 482,332,211 people shows a poor positive correlation between the proportion of Greeks and percentage of married-couple family households in the United States with a correlation coefficient (R) of 0.124 and weighted average of 48.9%, a difference of 2.2%.
Married-couple Households Correlation Summary
| Measurement | Immigrants from North Macedonia | Greek |
| Minimum | 28.5% | 14.1% |
| Maximum | 85.7% | 100.0% |
| Range | 57.2% | 85.9% |
| Mean | 51.1% | 53.9% |
| Median | 50.5% | 53.0% |
| Interquartile 25% (IQ1) | 47.9% | 42.3% |
| Interquartile 75% (IQ3) | 54.8% | 60.0% |
| Interquartile Range (IQR) | 6.9% | 17.7% |
| Standard Deviation (Sample) | 9.2% | 18.6% |
| Standard Deviation (Population) | 9.0% | 18.5% |
Similar Demographics by Married-couple Households
Demographics Similar to Immigrants from North Macedonia by Married-couple Households
In terms of married-couple households, the demographic groups most similar to Immigrants from North Macedonia are Latvian (47.9%, a difference of 0.010%), Immigrants from Austria (47.9%, a difference of 0.010%), Immigrants from Italy (47.9%, a difference of 0.020%), Immigrants from Egypt (47.9%, a difference of 0.040%), and Turkish (47.8%, a difference of 0.080%).
| Demographics | Rating | Rank | Married-couple Households |
| Immigrants | Moldova | 97.0 /100 | #91 | Exceptional 48.0% |
| Palestinians | 96.9 /100 | #92 | Exceptional 48.0% |
| Lebanese | 96.9 /100 | #93 | Exceptional 47.9% |
| Americans | 96.9 /100 | #94 | Exceptional 47.9% |
| Immigrants | Belgium | 96.8 /100 | #95 | Exceptional 47.9% |
| Immigrants | Egypt | 96.6 /100 | #96 | Exceptional 47.9% |
| Latvians | 96.5 /100 | #97 | Exceptional 47.9% |
| Immigrants | North Macedonia | 96.4 /100 | #98 | Exceptional 47.9% |
| Immigrants | Austria | 96.4 /100 | #99 | Exceptional 47.9% |
| Immigrants | Italy | 96.3 /100 | #100 | Exceptional 47.9% |
| Turks | 96.1 /100 | #101 | Exceptional 47.8% |
| Slavs | 96.0 /100 | #102 | Exceptional 47.8% |
| Hawaiians | 96.0 /100 | #103 | Exceptional 47.8% |
| Immigrants | South Africa | 96.0 /100 | #104 | Exceptional 47.8% |
| Immigrants | Czechoslovakia | 95.5 /100 | #105 | Exceptional 47.8% |
Demographics Similar to Greeks by Married-couple Households
In terms of married-couple households, the demographic groups most similar to Greeks are Lithuanian (48.9%, a difference of 0.080%), Sri Lankan (49.0%, a difference of 0.090%), Iranian (49.0%, a difference of 0.10%), Immigrants from Bolivia (48.9%, a difference of 0.10%), and Immigrants from Lebanon (48.9%, a difference of 0.13%).
| Demographics | Rating | Rank | Married-couple Households |
| Native Hawaiians | 99.8 /100 | #31 | Exceptional 49.1% |
| Hungarians | 99.8 /100 | #32 | Exceptional 49.1% |
| Immigrants | Asia | 99.7 /100 | #33 | Exceptional 49.1% |
| Italians | 99.7 /100 | #34 | Exceptional 49.0% |
| Scottish | 99.7 /100 | #35 | Exceptional 49.0% |
| Iranians | 99.7 /100 | #36 | Exceptional 49.0% |
| Sri Lankans | 99.7 /100 | #37 | Exceptional 49.0% |
| Greeks | 99.7 /100 | #38 | Exceptional 48.9% |
| Lithuanians | 99.6 /100 | #39 | Exceptional 48.9% |
| Immigrants | Bolivia | 99.6 /100 | #40 | Exceptional 48.9% |
| Immigrants | Lebanon | 99.6 /100 | #41 | Exceptional 48.9% |
| Immigrants | Vietnam | 99.6 /100 | #42 | Exceptional 48.8% |
| Immigrants | Iran | 99.6 /100 | #43 | Exceptional 48.8% |
| Welsh | 99.5 /100 | #44 | Exceptional 48.8% |
| Immigrants | Eastern Asia | 99.5 /100 | #45 | Exceptional 48.8% |