Shoshone vs Immigrants from Burma/Myanmar Family Households
COMPARE
Shoshone
Immigrants from Burma/Myanmar
Family Households
Family Households Comparison
Shoshone
Immigrants from Burma/Myanmar
63.8%
FAMILY HOUSEHOLDS
9.4/ 100
METRIC RATING
211th/ 347
METRIC RANK
62.6%
FAMILY HOUSEHOLDS
0.0/ 100
METRIC RATING
292nd/ 347
METRIC RANK
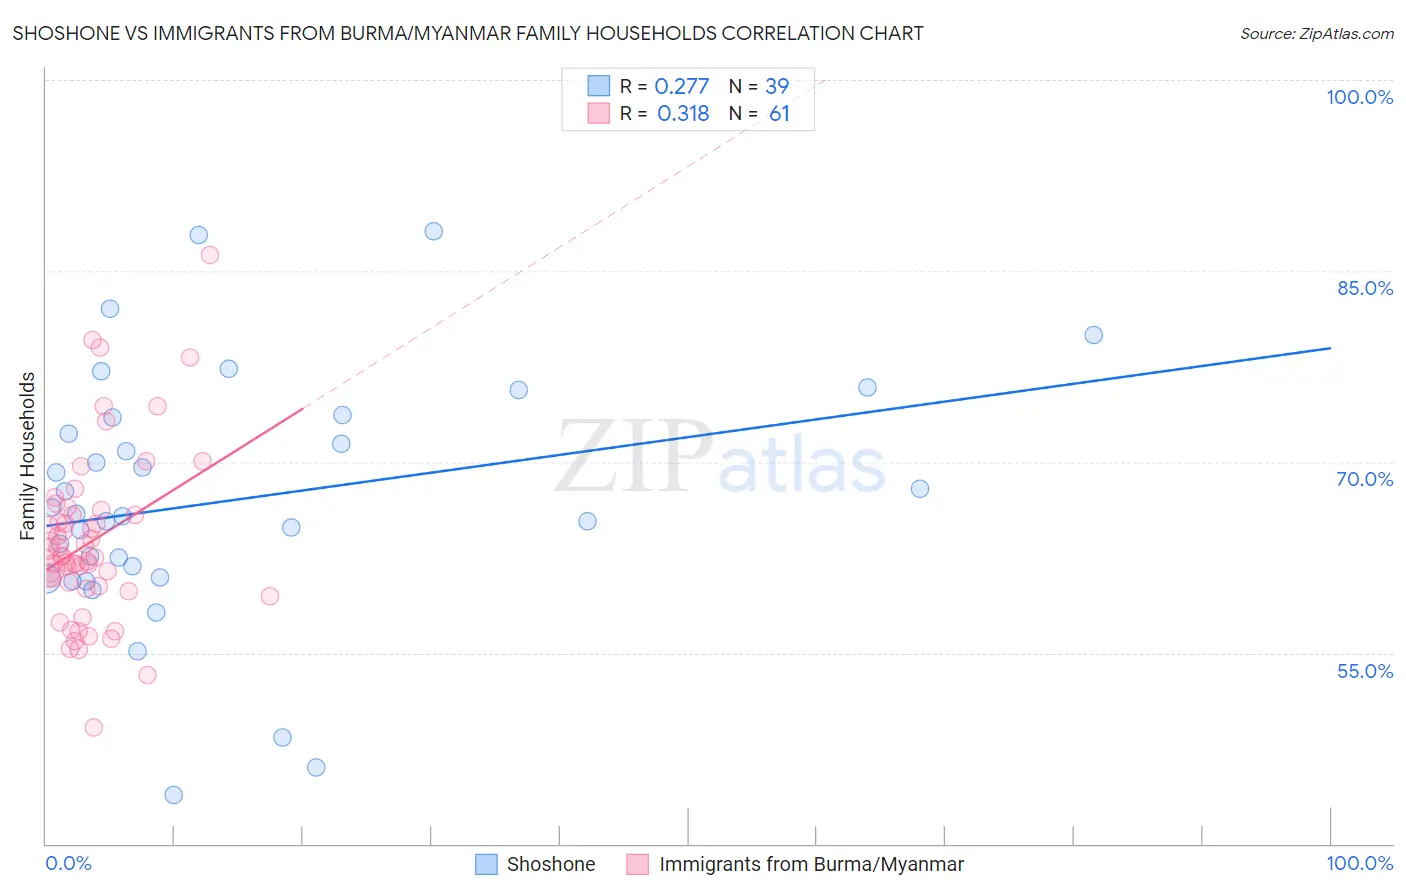
Shoshone vs Immigrants from Burma/Myanmar Family Households Correlation Chart
The statistical analysis conducted on geographies consisting of 66,615,877 people shows a weak positive correlation between the proportion of Shoshone and percentage of family households in the United States with a correlation coefficient (R) of 0.277 and weighted average of 63.8%. Similarly, the statistical analysis conducted on geographies consisting of 172,273,179 people shows a mild positive correlation between the proportion of Immigrants from Burma/Myanmar and percentage of family households in the United States with a correlation coefficient (R) of 0.318 and weighted average of 62.6%, a difference of 2.0%.
Family Households Correlation Summary
| Measurement | Shoshone | Immigrants from Burma/Myanmar |
| Minimum | 43.8% | 49.1% |
| Maximum | 88.1% | 86.2% |
| Range | 44.3% | 37.1% |
| Mean | 67.0% | 63.7% |
| Median | 65.9% | 62.5% |
| Interquartile 25% (IQ1) | 60.9% | 60.1% |
| Interquartile 75% (IQ3) | 73.5% | 66.0% |
| Interquartile Range (IQR) | 12.6% | 5.9% |
| Standard Deviation (Sample) | 9.8% | 6.7% |
| Standard Deviation (Population) | 9.7% | 6.6% |
Similar Demographics by Family Households
Demographics Similar to Shoshone by Family Households
In terms of family households, the demographic groups most similar to Shoshone are Immigrants from Netherlands (63.8%, a difference of 0.0%), Immigrants from Thailand (63.8%, a difference of 0.010%), Immigrants from Northern Europe (63.8%, a difference of 0.020%), Celtic (63.8%, a difference of 0.060%), and Nigerian (63.9%, a difference of 0.070%).
| Demographics | Rating | Rank | Family Households |
| Immigrants | Uruguay | 12.8 /100 | #204 | Poor 63.9% |
| Brazilians | 12.4 /100 | #205 | Poor 63.9% |
| Immigrants | Lithuania | 12.1 /100 | #206 | Poor 63.9% |
| Nigerians | 11.5 /100 | #207 | Poor 63.9% |
| Immigrants | Bangladesh | 11.4 /100 | #208 | Poor 63.9% |
| Sierra Leoneans | 11.2 /100 | #209 | Poor 63.9% |
| Immigrants | Thailand | 9.6 /100 | #210 | Tragic 63.8% |
| Shoshone | 9.4 /100 | #211 | Tragic 63.8% |
| Immigrants | Netherlands | 9.4 /100 | #212 | Tragic 63.8% |
| Immigrants | Northern Europe | 8.8 /100 | #213 | Tragic 63.8% |
| Celtics | 8.0 /100 | #214 | Tragic 63.8% |
| Belgians | 7.6 /100 | #215 | Tragic 63.8% |
| Croatians | 7.3 /100 | #216 | Tragic 63.8% |
| Osage | 7.0 /100 | #217 | Tragic 63.7% |
| Marshallese | 6.9 /100 | #218 | Tragic 63.7% |
Demographics Similar to Immigrants from Burma/Myanmar by Family Households
In terms of family households, the demographic groups most similar to Immigrants from Burma/Myanmar are U.S. Virgin Islander (62.6%, a difference of 0.050%), Immigrants from Grenada (62.6%, a difference of 0.10%), Immigrants from Sweden (62.5%, a difference of 0.13%), Immigrants from Nepal (62.7%, a difference of 0.18%), and Barbadian (62.5%, a difference of 0.19%).
| Demographics | Rating | Rank | Family Households |
| Mongolians | 0.1 /100 | #285 | Tragic 62.8% |
| British West Indians | 0.1 /100 | #286 | Tragic 62.8% |
| Latvians | 0.1 /100 | #287 | Tragic 62.8% |
| Immigrants | Uganda | 0.1 /100 | #288 | Tragic 62.7% |
| Immigrants | Nepal | 0.1 /100 | #289 | Tragic 62.7% |
| Immigrants | Grenada | 0.0 /100 | #290 | Tragic 62.6% |
| U.S. Virgin Islanders | 0.0 /100 | #291 | Tragic 62.6% |
| Immigrants | Burma/Myanmar | 0.0 /100 | #292 | Tragic 62.6% |
| Immigrants | Sweden | 0.0 /100 | #293 | Tragic 62.5% |
| Barbadians | 0.0 /100 | #294 | Tragic 62.5% |
| Okinawans | 0.0 /100 | #295 | Tragic 62.5% |
| Slovenes | 0.0 /100 | #296 | Tragic 62.4% |
| French American Indians | 0.0 /100 | #297 | Tragic 62.4% |
| Immigrants | Spain | 0.0 /100 | #298 | Tragic 62.4% |
| Immigrants | Kuwait | 0.0 /100 | #299 | Tragic 62.4% |