Immigrants from West Indies vs Immigrants from Burma/Myanmar Family Households
COMPARE
Immigrants from West Indies
Immigrants from Burma/Myanmar
Family Households
Family Households Comparison
Immigrants from West Indies
Immigrants from Burma/Myanmar
61.6%
FAMILY HOUSEHOLDS
0.0/ 100
METRIC RATING
324th/ 347
METRIC RANK
62.6%
FAMILY HOUSEHOLDS
0.0/ 100
METRIC RATING
292nd/ 347
METRIC RANK
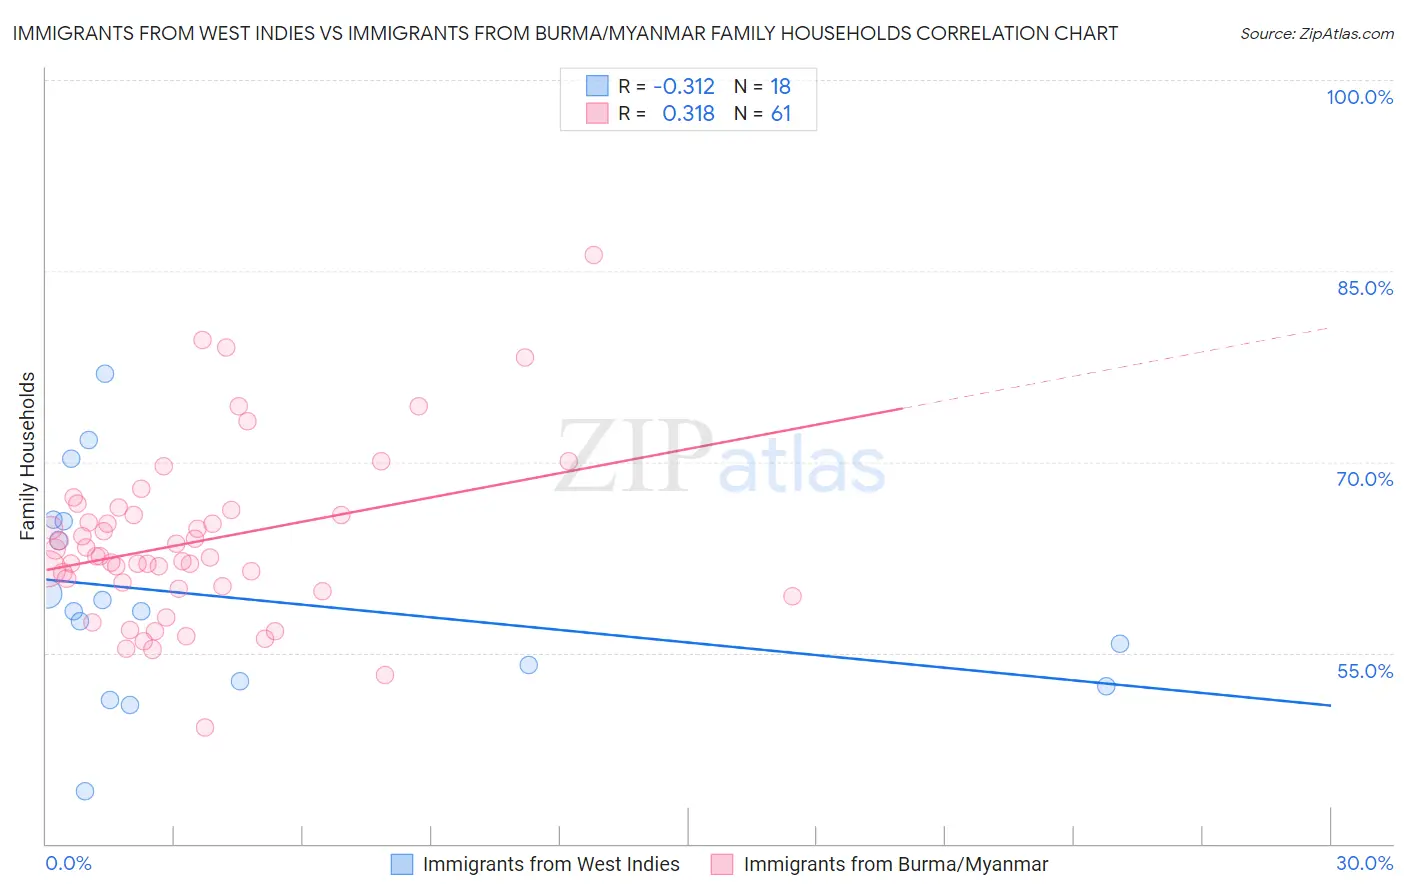
Immigrants from West Indies vs Immigrants from Burma/Myanmar Family Households Correlation Chart
The statistical analysis conducted on geographies consisting of 72,452,456 people shows a mild negative correlation between the proportion of Immigrants from West Indies and percentage of family households in the United States with a correlation coefficient (R) of -0.312 and weighted average of 61.6%. Similarly, the statistical analysis conducted on geographies consisting of 172,273,179 people shows a mild positive correlation between the proportion of Immigrants from Burma/Myanmar and percentage of family households in the United States with a correlation coefficient (R) of 0.318 and weighted average of 62.6%, a difference of 1.6%.
Family Households Correlation Summary
| Measurement | Immigrants from West Indies | Immigrants from Burma/Myanmar |
| Minimum | 44.1% | 49.1% |
| Maximum | 77.0% | 86.2% |
| Range | 32.9% | 37.1% |
| Mean | 59.3% | 63.7% |
| Median | 58.3% | 62.5% |
| Interquartile 25% (IQ1) | 52.8% | 60.1% |
| Interquartile 75% (IQ3) | 65.4% | 66.0% |
| Interquartile Range (IQR) | 12.5% | 5.9% |
| Standard Deviation (Sample) | 8.3% | 6.7% |
| Standard Deviation (Population) | 8.1% | 6.6% |
Similar Demographics by Family Households
Demographics Similar to Immigrants from West Indies by Family Households
In terms of family households, the demographic groups most similar to Immigrants from West Indies are Immigrants from Serbia (61.6%, a difference of 0.010%), Tlingit-Haida (61.6%, a difference of 0.010%), Immigrants from Switzerland (61.6%, a difference of 0.010%), Alsatian (61.7%, a difference of 0.10%), and Ugandan (61.7%, a difference of 0.16%).
| Demographics | Rating | Rank | Family Households |
| Immigrants | Bosnia and Herzegovina | 0.0 /100 | #317 | Tragic 61.9% |
| Alaskan Athabascans | 0.0 /100 | #318 | Tragic 61.8% |
| Cape Verdeans | 0.0 /100 | #319 | Tragic 61.8% |
| Ugandans | 0.0 /100 | #320 | Tragic 61.7% |
| Alsatians | 0.0 /100 | #321 | Tragic 61.7% |
| Immigrants | Serbia | 0.0 /100 | #322 | Tragic 61.6% |
| Tlingit-Haida | 0.0 /100 | #323 | Tragic 61.6% |
| Immigrants | West Indies | 0.0 /100 | #324 | Tragic 61.6% |
| Immigrants | Switzerland | 0.0 /100 | #325 | Tragic 61.6% |
| Indonesians | 0.0 /100 | #326 | Tragic 61.5% |
| Blacks/African Americans | 0.0 /100 | #327 | Tragic 61.5% |
| Kiowa | 0.0 /100 | #328 | Tragic 61.4% |
| Cambodians | 0.0 /100 | #329 | Tragic 61.4% |
| Immigrants | Australia | 0.0 /100 | #330 | Tragic 61.3% |
| Immigrants | France | 0.0 /100 | #331 | Tragic 61.3% |
Demographics Similar to Immigrants from Burma/Myanmar by Family Households
In terms of family households, the demographic groups most similar to Immigrants from Burma/Myanmar are U.S. Virgin Islander (62.6%, a difference of 0.050%), Immigrants from Grenada (62.6%, a difference of 0.10%), Immigrants from Sweden (62.5%, a difference of 0.13%), Immigrants from Nepal (62.7%, a difference of 0.18%), and Barbadian (62.5%, a difference of 0.19%).
| Demographics | Rating | Rank | Family Households |
| Mongolians | 0.1 /100 | #285 | Tragic 62.8% |
| British West Indians | 0.1 /100 | #286 | Tragic 62.8% |
| Latvians | 0.1 /100 | #287 | Tragic 62.8% |
| Immigrants | Uganda | 0.1 /100 | #288 | Tragic 62.7% |
| Immigrants | Nepal | 0.1 /100 | #289 | Tragic 62.7% |
| Immigrants | Grenada | 0.0 /100 | #290 | Tragic 62.6% |
| U.S. Virgin Islanders | 0.0 /100 | #291 | Tragic 62.6% |
| Immigrants | Burma/Myanmar | 0.0 /100 | #292 | Tragic 62.6% |
| Immigrants | Sweden | 0.0 /100 | #293 | Tragic 62.5% |
| Barbadians | 0.0 /100 | #294 | Tragic 62.5% |
| Okinawans | 0.0 /100 | #295 | Tragic 62.5% |
| Slovenes | 0.0 /100 | #296 | Tragic 62.4% |
| French American Indians | 0.0 /100 | #297 | Tragic 62.4% |
| Immigrants | Spain | 0.0 /100 | #298 | Tragic 62.4% |
| Immigrants | Kuwait | 0.0 /100 | #299 | Tragic 62.4% |