Immigrants from Somalia vs Immigrants from Burma/Myanmar Family Households
COMPARE
Immigrants from Somalia
Immigrants from Burma/Myanmar
Family Households
Family Households Comparison
Immigrants from Somalia
Immigrants from Burma/Myanmar
56.7%
FAMILY HOUSEHOLDS
0.0/ 100
METRIC RATING
347th/ 347
METRIC RANK
62.6%
FAMILY HOUSEHOLDS
0.0/ 100
METRIC RATING
292nd/ 347
METRIC RANK
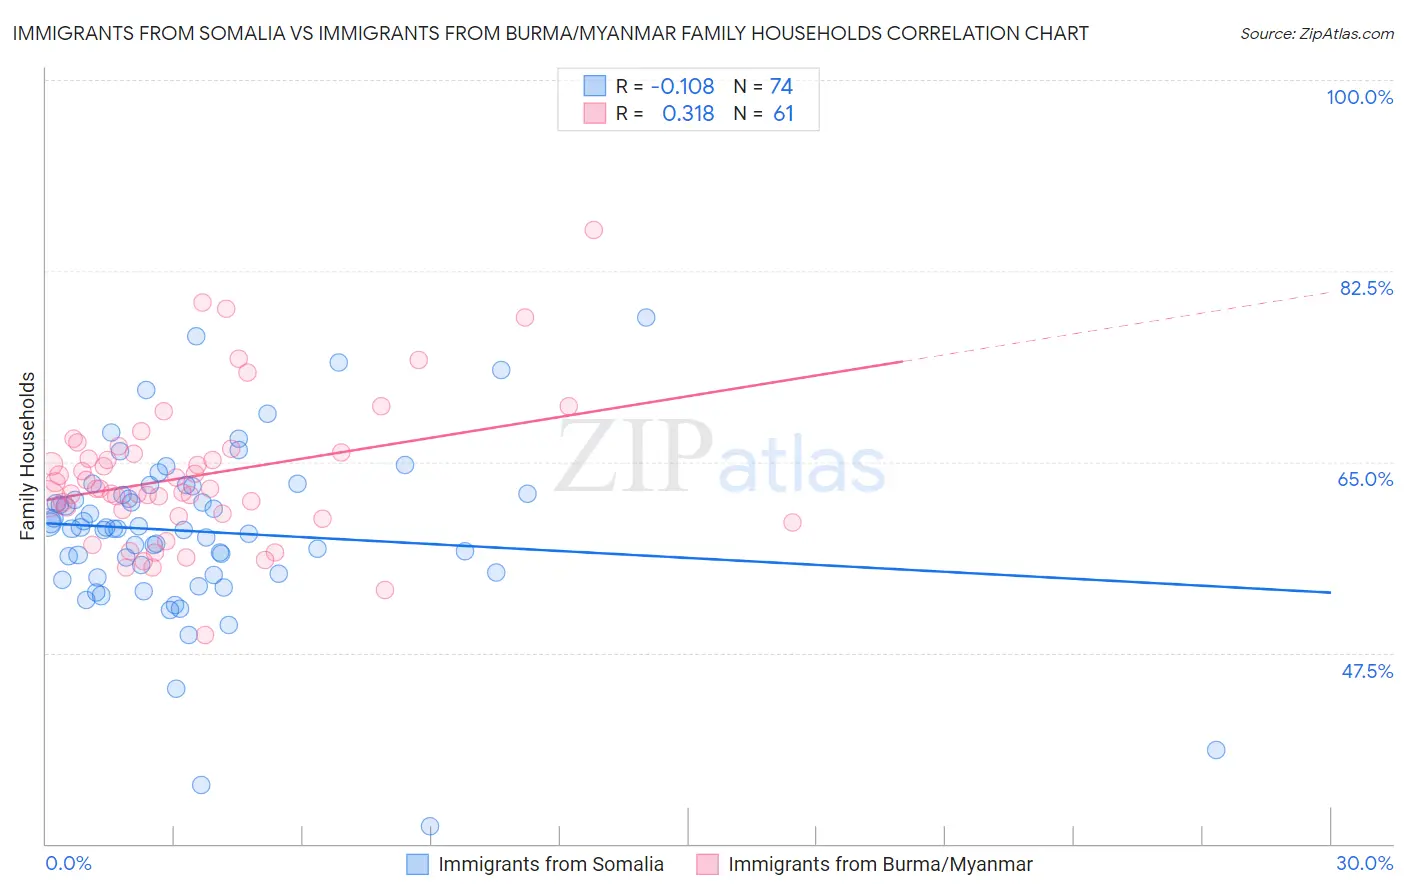
Immigrants from Somalia vs Immigrants from Burma/Myanmar Family Households Correlation Chart
The statistical analysis conducted on geographies consisting of 92,092,225 people shows a poor negative correlation between the proportion of Immigrants from Somalia and percentage of family households in the United States with a correlation coefficient (R) of -0.108 and weighted average of 56.7%. Similarly, the statistical analysis conducted on geographies consisting of 172,273,179 people shows a mild positive correlation between the proportion of Immigrants from Burma/Myanmar and percentage of family households in the United States with a correlation coefficient (R) of 0.318 and weighted average of 62.6%, a difference of 10.4%.
Family Households Correlation Summary
| Measurement | Immigrants from Somalia | Immigrants from Burma/Myanmar |
| Minimum | 31.6% | 49.1% |
| Maximum | 78.2% | 86.2% |
| Range | 46.6% | 37.1% |
| Mean | 58.6% | 63.7% |
| Median | 58.9% | 62.5% |
| Interquartile 25% (IQ1) | 54.8% | 60.1% |
| Interquartile 75% (IQ3) | 62.1% | 66.0% |
| Interquartile Range (IQR) | 7.3% | 5.9% |
| Standard Deviation (Sample) | 7.8% | 6.7% |
| Standard Deviation (Population) | 7.8% | 6.6% |
Similar Demographics by Family Households
Demographics Similar to Immigrants from Somalia by Family Households
In terms of family households, the demographic groups most similar to Immigrants from Somalia are Somali (57.6%, a difference of 1.7%), Immigrants from Zaire (59.2%, a difference of 4.4%), Immigrants from Congo (59.2%, a difference of 4.5%), Senegalese (59.8%, a difference of 5.6%), and Sudanese (60.0%, a difference of 5.9%).
| Demographics | Rating | Rank | Family Households |
| Immigrants | Ethiopia | 0.0 /100 | #333 | Tragic 61.2% |
| Immigrants | Eastern Africa | 0.0 /100 | #334 | Tragic 61.1% |
| Carpatho Rusyns | 0.0 /100 | #335 | Tragic 61.1% |
| German Russians | 0.0 /100 | #336 | Tragic 60.9% |
| Soviet Union | 0.0 /100 | #337 | Tragic 60.9% |
| Immigrants | Eritrea | 0.0 /100 | #338 | Tragic 60.8% |
| Immigrants | Saudi Arabia | 0.0 /100 | #339 | Tragic 60.7% |
| Immigrants | Sudan | 0.0 /100 | #340 | Tragic 60.2% |
| Immigrants | Senegal | 0.0 /100 | #341 | Tragic 60.1% |
| Sudanese | 0.0 /100 | #342 | Tragic 60.0% |
| Senegalese | 0.0 /100 | #343 | Tragic 59.8% |
| Immigrants | Congo | 0.0 /100 | #344 | Tragic 59.2% |
| Immigrants | Zaire | 0.0 /100 | #345 | Tragic 59.2% |
| Somalis | 0.0 /100 | #346 | Tragic 57.6% |
| Immigrants | Somalia | 0.0 /100 | #347 | Tragic 56.7% |
Demographics Similar to Immigrants from Burma/Myanmar by Family Households
In terms of family households, the demographic groups most similar to Immigrants from Burma/Myanmar are U.S. Virgin Islander (62.6%, a difference of 0.050%), Immigrants from Grenada (62.6%, a difference of 0.10%), Immigrants from Sweden (62.5%, a difference of 0.13%), Immigrants from Nepal (62.7%, a difference of 0.18%), and Barbadian (62.5%, a difference of 0.19%).
| Demographics | Rating | Rank | Family Households |
| Mongolians | 0.1 /100 | #285 | Tragic 62.8% |
| British West Indians | 0.1 /100 | #286 | Tragic 62.8% |
| Latvians | 0.1 /100 | #287 | Tragic 62.8% |
| Immigrants | Uganda | 0.1 /100 | #288 | Tragic 62.7% |
| Immigrants | Nepal | 0.1 /100 | #289 | Tragic 62.7% |
| Immigrants | Grenada | 0.0 /100 | #290 | Tragic 62.6% |
| U.S. Virgin Islanders | 0.0 /100 | #291 | Tragic 62.6% |
| Immigrants | Burma/Myanmar | 0.0 /100 | #292 | Tragic 62.6% |
| Immigrants | Sweden | 0.0 /100 | #293 | Tragic 62.5% |
| Barbadians | 0.0 /100 | #294 | Tragic 62.5% |
| Okinawans | 0.0 /100 | #295 | Tragic 62.5% |
| Slovenes | 0.0 /100 | #296 | Tragic 62.4% |
| French American Indians | 0.0 /100 | #297 | Tragic 62.4% |
| Immigrants | Spain | 0.0 /100 | #298 | Tragic 62.4% |
| Immigrants | Kuwait | 0.0 /100 | #299 | Tragic 62.4% |