Cypriot vs Immigrants from Burma/Myanmar Family Households
COMPARE
Cypriot
Immigrants from Burma/Myanmar
Family Households
Family Households Comparison
Cypriots
Immigrants from Burma/Myanmar
63.2%
FAMILY HOUSEHOLDS
0.6/ 100
METRIC RATING
260th/ 347
METRIC RANK
62.6%
FAMILY HOUSEHOLDS
0.0/ 100
METRIC RATING
292nd/ 347
METRIC RANK
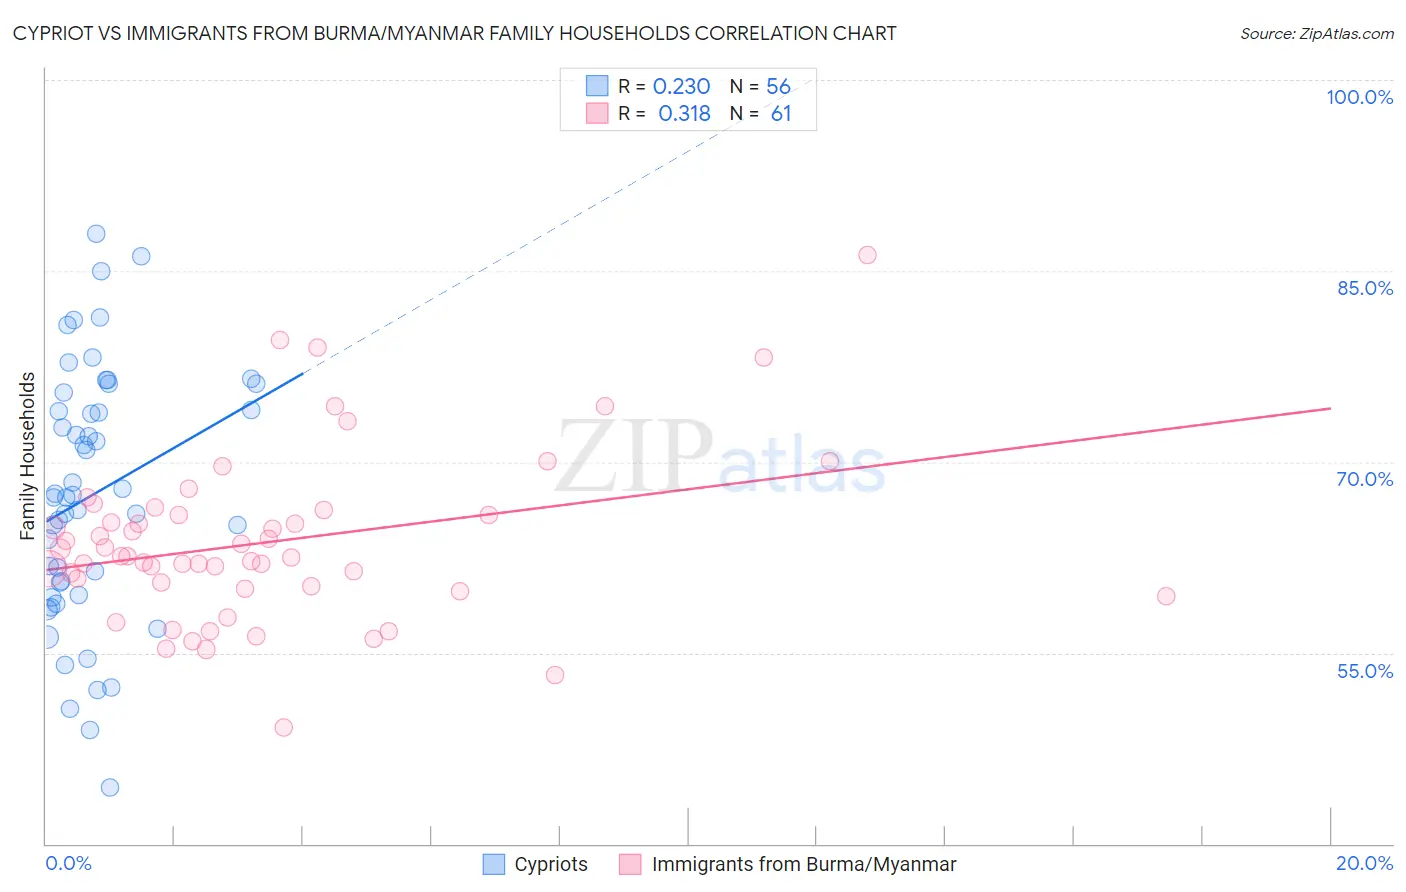
Cypriot vs Immigrants from Burma/Myanmar Family Households Correlation Chart
The statistical analysis conducted on geographies consisting of 61,857,015 people shows a weak positive correlation between the proportion of Cypriots and percentage of family households in the United States with a correlation coefficient (R) of 0.230 and weighted average of 63.2%. Similarly, the statistical analysis conducted on geographies consisting of 172,273,179 people shows a mild positive correlation between the proportion of Immigrants from Burma/Myanmar and percentage of family households in the United States with a correlation coefficient (R) of 0.318 and weighted average of 62.6%, a difference of 0.98%.
Family Households Correlation Summary
| Measurement | Cypriot | Immigrants from Burma/Myanmar |
| Minimum | 44.4% | 49.1% |
| Maximum | 87.9% | 86.2% |
| Range | 43.5% | 37.1% |
| Mean | 67.4% | 63.7% |
| Median | 67.3% | 62.5% |
| Interquartile 25% (IQ1) | 60.0% | 60.1% |
| Interquartile 75% (IQ3) | 74.7% | 66.0% |
| Interquartile Range (IQR) | 14.7% | 5.9% |
| Standard Deviation (Sample) | 9.9% | 6.7% |
| Standard Deviation (Population) | 9.8% | 6.6% |
Similar Demographics by Family Households
Demographics Similar to Cypriots by Family Households
In terms of family households, the demographic groups most similar to Cypriots are Immigrants from Western Europe (63.2%, a difference of 0.020%), Immigrants from Russia (63.2%, a difference of 0.020%), Immigrants from Barbados (63.2%, a difference of 0.030%), Immigrants from Ireland (63.2%, a difference of 0.030%), and Cheyenne (63.2%, a difference of 0.050%).
| Demographics | Rating | Rank | Family Households |
| Immigrants | Dominican Republic | 1.0 /100 | #253 | Tragic 63.3% |
| Slovaks | 1.0 /100 | #254 | Tragic 63.3% |
| Potawatomi | 1.0 /100 | #255 | Tragic 63.3% |
| Luxembourgers | 0.9 /100 | #256 | Tragic 63.3% |
| Icelanders | 0.8 /100 | #257 | Tragic 63.3% |
| Immigrants | Barbados | 0.7 /100 | #258 | Tragic 63.2% |
| Immigrants | Western Europe | 0.6 /100 | #259 | Tragic 63.2% |
| Cypriots | 0.6 /100 | #260 | Tragic 63.2% |
| Immigrants | Russia | 0.6 /100 | #261 | Tragic 63.2% |
| Immigrants | Ireland | 0.6 /100 | #262 | Tragic 63.2% |
| Cheyenne | 0.5 /100 | #263 | Tragic 63.2% |
| Kenyans | 0.5 /100 | #264 | Tragic 63.2% |
| Colville | 0.5 /100 | #265 | Tragic 63.2% |
| Immigrants | Western Africa | 0.5 /100 | #266 | Tragic 63.1% |
| Israelis | 0.4 /100 | #267 | Tragic 63.1% |
Demographics Similar to Immigrants from Burma/Myanmar by Family Households
In terms of family households, the demographic groups most similar to Immigrants from Burma/Myanmar are U.S. Virgin Islander (62.6%, a difference of 0.050%), Immigrants from Grenada (62.6%, a difference of 0.10%), Immigrants from Sweden (62.5%, a difference of 0.13%), Immigrants from Nepal (62.7%, a difference of 0.18%), and Barbadian (62.5%, a difference of 0.19%).
| Demographics | Rating | Rank | Family Households |
| Mongolians | 0.1 /100 | #285 | Tragic 62.8% |
| British West Indians | 0.1 /100 | #286 | Tragic 62.8% |
| Latvians | 0.1 /100 | #287 | Tragic 62.8% |
| Immigrants | Uganda | 0.1 /100 | #288 | Tragic 62.7% |
| Immigrants | Nepal | 0.1 /100 | #289 | Tragic 62.7% |
| Immigrants | Grenada | 0.0 /100 | #290 | Tragic 62.6% |
| U.S. Virgin Islanders | 0.0 /100 | #291 | Tragic 62.6% |
| Immigrants | Burma/Myanmar | 0.0 /100 | #292 | Tragic 62.6% |
| Immigrants | Sweden | 0.0 /100 | #293 | Tragic 62.5% |
| Barbadians | 0.0 /100 | #294 | Tragic 62.5% |
| Okinawans | 0.0 /100 | #295 | Tragic 62.5% |
| Slovenes | 0.0 /100 | #296 | Tragic 62.4% |
| French American Indians | 0.0 /100 | #297 | Tragic 62.4% |
| Immigrants | Spain | 0.0 /100 | #298 | Tragic 62.4% |
| Immigrants | Kuwait | 0.0 /100 | #299 | Tragic 62.4% |