Immigrants from North America vs French Married-couple Households
COMPARE
Immigrants from North America
French
Married-couple Households
Married-couple Households Comparison
Immigrants from North America
French
48.4%
MARRIED-COUPLE HOUSEHOLDS
98.9/ 100
METRIC RATING
70th/ 347
METRIC RANK
48.0%
MARRIED-COUPLE HOUSEHOLDS
97.2/ 100
METRIC RATING
90th/ 347
METRIC RANK
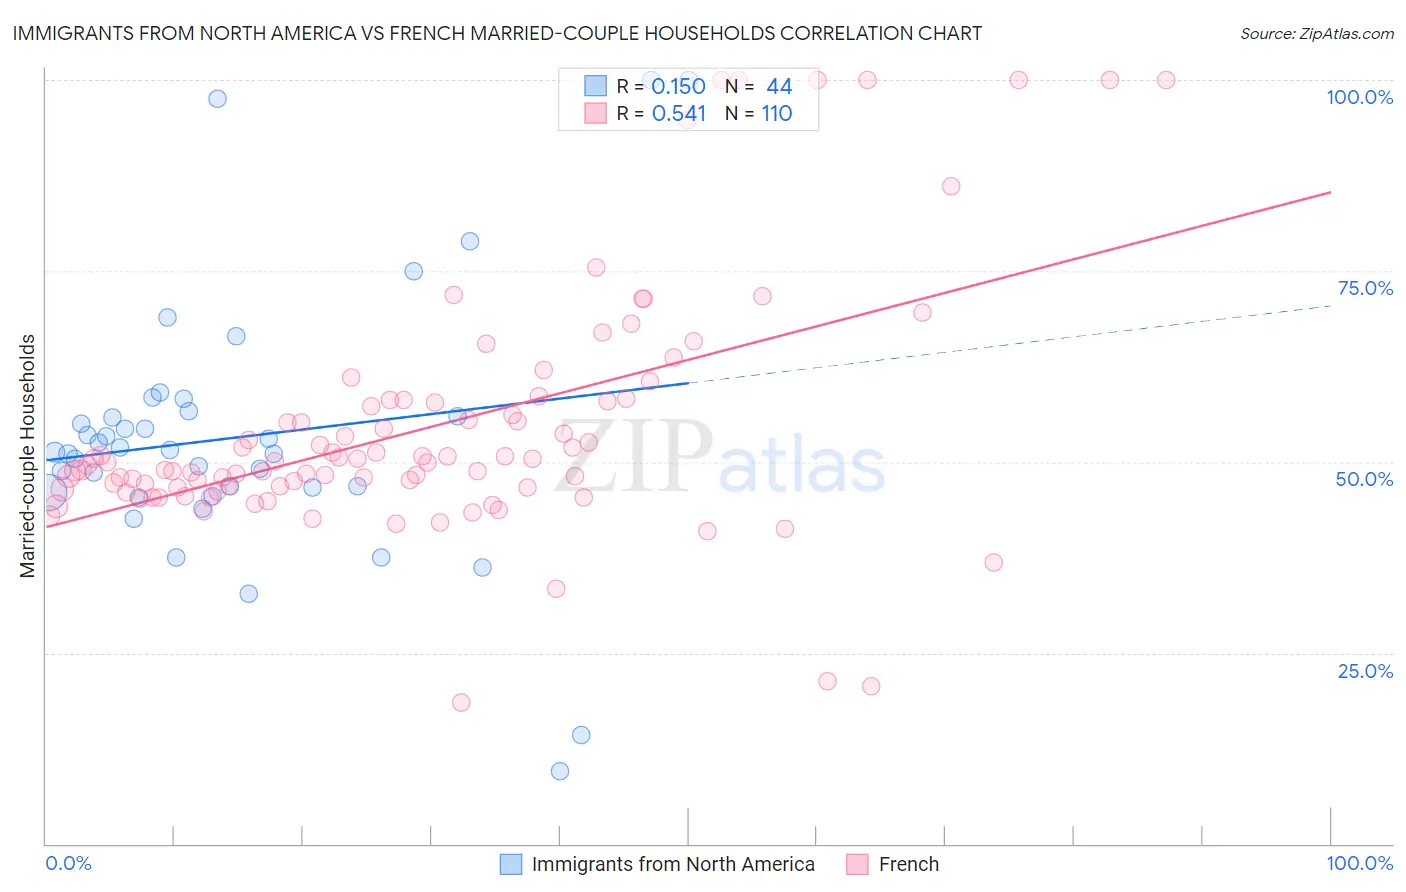
Immigrants from North America vs French Married-couple Households Correlation Chart
The statistical analysis conducted on geographies consisting of 462,174,767 people shows a poor positive correlation between the proportion of Immigrants from North America and percentage of married-couple family households in the United States with a correlation coefficient (R) of 0.150 and weighted average of 48.4%. Similarly, the statistical analysis conducted on geographies consisting of 571,775,805 people shows a substantial positive correlation between the proportion of French and percentage of married-couple family households in the United States with a correlation coefficient (R) of 0.541 and weighted average of 48.0%, a difference of 0.83%.
Married-couple Households Correlation Summary
| Measurement | Immigrants from North America | French |
| Minimum | 9.5% | 18.5% |
| Maximum | 100.0% | 100.0% |
| Range | 90.5% | 81.5% |
| Mean | 53.2% | 54.4% |
| Median | 51.3% | 49.9% |
| Interquartile 25% (IQ1) | 46.3% | 46.7% |
| Interquartile 75% (IQ3) | 56.3% | 57.9% |
| Interquartile Range (IQR) | 10.0% | 11.2% |
| Standard Deviation (Sample) | 17.6% | 16.0% |
| Standard Deviation (Population) | 17.3% | 15.9% |
Demographics Similar to Immigrants from North America and French by Married-couple Households
In terms of married-couple households, the demographic groups most similar to Immigrants from North America are Laotian (48.4%, a difference of 0.010%), Scotch-Irish (48.3%, a difference of 0.18%), Immigrants from Singapore (48.3%, a difference of 0.20%), Immigrants from Romania (48.3%, a difference of 0.22%), and Immigrants from England (48.2%, a difference of 0.31%). Similarly, the demographic groups most similar to French are Cypriot (48.0%, a difference of 0.010%), Afghan (48.0%, a difference of 0.040%), Immigrants from Ireland (48.0%, a difference of 0.050%), Belgian (48.0%, a difference of 0.060%), and Immigrants from Israel (48.0%, a difference of 0.090%).
| Demographics | Rating | Rank | Married-couple Households |
| Immigrants | North America | 98.9 /100 | #70 | Exceptional 48.4% |
| Laotians | 98.8 /100 | #71 | Exceptional 48.4% |
| Scotch-Irish | 98.6 /100 | #72 | Exceptional 48.3% |
| Immigrants | Singapore | 98.6 /100 | #73 | Exceptional 48.3% |
| Immigrants | Romania | 98.6 /100 | #74 | Exceptional 48.3% |
| Immigrants | England | 98.4 /100 | #75 | Exceptional 48.2% |
| Immigrants | Fiji | 98.4 /100 | #76 | Exceptional 48.2% |
| Canadians | 98.2 /100 | #77 | Exceptional 48.2% |
| Egyptians | 98.2 /100 | #78 | Exceptional 48.2% |
| Immigrants | Netherlands | 98.2 /100 | #79 | Exceptional 48.2% |
| Russians | 98.1 /100 | #80 | Exceptional 48.2% |
| Finns | 98.0 /100 | #81 | Exceptional 48.1% |
| Immigrants | Poland | 97.7 /100 | #82 | Exceptional 48.1% |
| Guamanians/Chamorros | 97.6 /100 | #83 | Exceptional 48.1% |
| Ukrainians | 97.6 /100 | #84 | Exceptional 48.1% |
| Immigrants | Israel | 97.4 /100 | #85 | Exceptional 48.0% |
| Belgians | 97.4 /100 | #86 | Exceptional 48.0% |
| Immigrants | Ireland | 97.3 /100 | #87 | Exceptional 48.0% |
| Afghans | 97.3 /100 | #88 | Exceptional 48.0% |
| Cypriots | 97.2 /100 | #89 | Exceptional 48.0% |
| French | 97.2 /100 | #90 | Exceptional 48.0% |