Immigrants from North America vs Soviet Union Married-couple Households
COMPARE
Immigrants from North America
Soviet Union
Married-couple Households
Married-couple Households Comparison
Immigrants from North America
Soviet Union
48.4%
MARRIED-COUPLE HOUSEHOLDS
98.9/ 100
METRIC RATING
70th/ 347
METRIC RANK
44.6%
MARRIED-COUPLE HOUSEHOLDS
1.6/ 100
METRIC RATING
230th/ 347
METRIC RANK
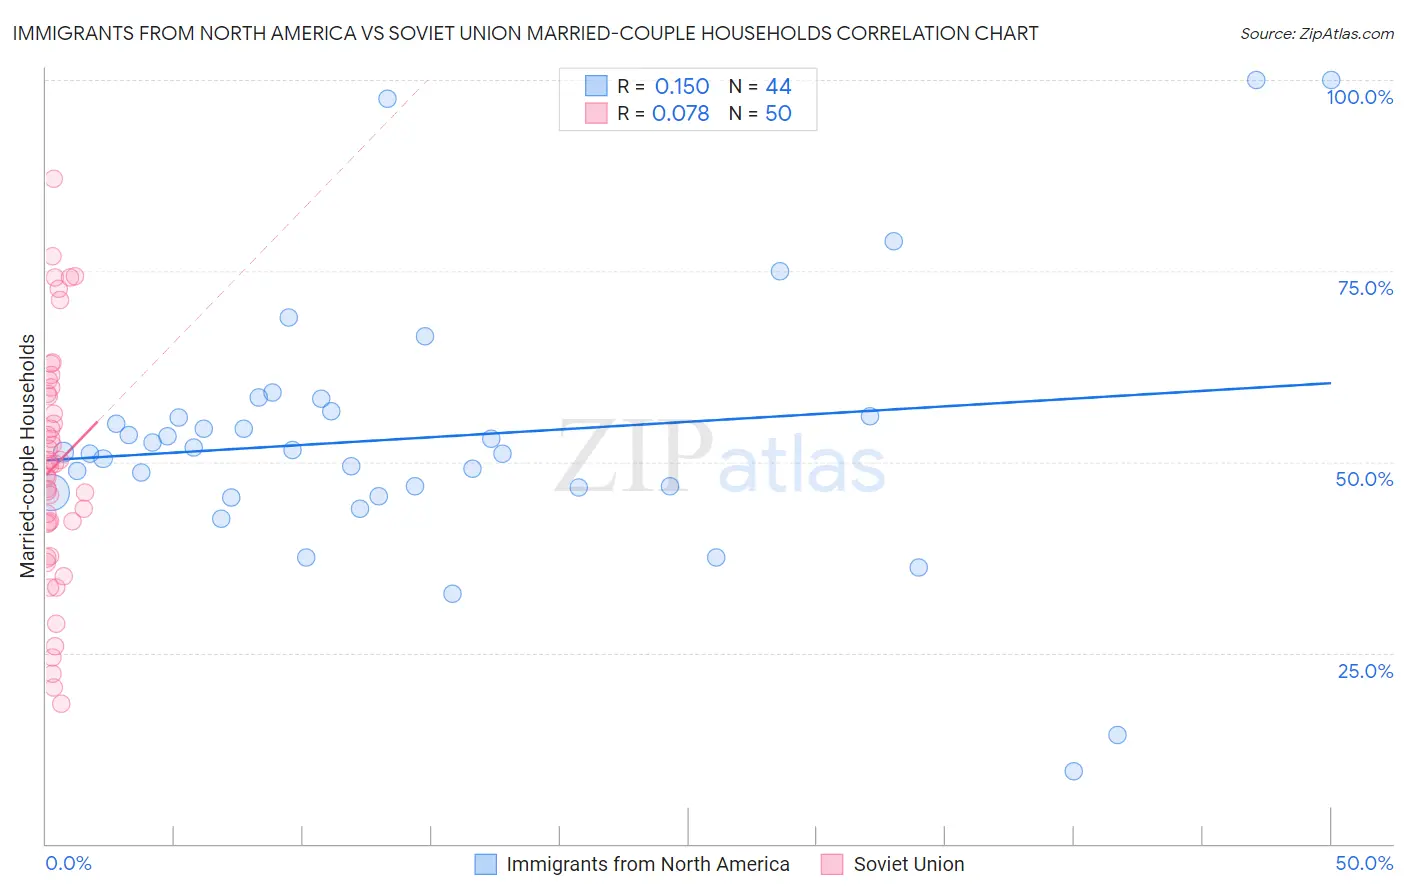
Immigrants from North America vs Soviet Union Married-couple Households Correlation Chart
The statistical analysis conducted on geographies consisting of 462,174,767 people shows a poor positive correlation between the proportion of Immigrants from North America and percentage of married-couple family households in the United States with a correlation coefficient (R) of 0.150 and weighted average of 48.4%. Similarly, the statistical analysis conducted on geographies consisting of 43,509,630 people shows a slight positive correlation between the proportion of Soviet Union and percentage of married-couple family households in the United States with a correlation coefficient (R) of 0.078 and weighted average of 44.6%, a difference of 8.4%.
Married-couple Households Correlation Summary
| Measurement | Immigrants from North America | Soviet Union |
| Minimum | 9.5% | 18.4% |
| Maximum | 100.0% | 87.0% |
| Range | 90.5% | 68.6% |
| Mean | 53.2% | 49.4% |
| Median | 51.3% | 49.6% |
| Interquartile 25% (IQ1) | 46.3% | 41.9% |
| Interquartile 75% (IQ3) | 56.3% | 58.9% |
| Interquartile Range (IQR) | 10.0% | 17.0% |
| Standard Deviation (Sample) | 17.6% | 15.5% |
| Standard Deviation (Population) | 17.3% | 15.3% |
Similar Demographics by Married-couple Households
Demographics Similar to Immigrants from North America by Married-couple Households
In terms of married-couple households, the demographic groups most similar to Immigrants from North America are Laotian (48.4%, a difference of 0.010%), Immigrants from South Eastern Asia (48.4%, a difference of 0.040%), Immigrants from China (48.4%, a difference of 0.040%), Jordanian (48.4%, a difference of 0.060%), and Romanian (48.4%, a difference of 0.060%).
| Demographics | Rating | Rank | Married-couple Households |
| Basques | 99.0 /100 | #63 | Exceptional 48.4% |
| Northern Europeans | 99.0 /100 | #64 | Exceptional 48.4% |
| Immigrants | Canada | 99.0 /100 | #65 | Exceptional 48.4% |
| Jordanians | 98.9 /100 | #66 | Exceptional 48.4% |
| Romanians | 98.9 /100 | #67 | Exceptional 48.4% |
| Immigrants | South Eastern Asia | 98.9 /100 | #68 | Exceptional 48.4% |
| Immigrants | China | 98.9 /100 | #69 | Exceptional 48.4% |
| Immigrants | North America | 98.9 /100 | #70 | Exceptional 48.4% |
| Laotians | 98.8 /100 | #71 | Exceptional 48.4% |
| Scotch-Irish | 98.6 /100 | #72 | Exceptional 48.3% |
| Immigrants | Singapore | 98.6 /100 | #73 | Exceptional 48.3% |
| Immigrants | Romania | 98.6 /100 | #74 | Exceptional 48.3% |
| Immigrants | England | 98.4 /100 | #75 | Exceptional 48.2% |
| Immigrants | Fiji | 98.4 /100 | #76 | Exceptional 48.2% |
| Canadians | 98.2 /100 | #77 | Exceptional 48.2% |
Demographics Similar to Soviet Union by Married-couple Households
In terms of married-couple households, the demographic groups most similar to Soviet Union are Houma (44.6%, a difference of 0.010%), Marshallese (44.6%, a difference of 0.010%), Immigrants from Latin America (44.7%, a difference of 0.040%), Immigrants from Uganda (44.6%, a difference of 0.050%), and Kenyan (44.7%, a difference of 0.090%).
| Demographics | Rating | Rank | Married-couple Households |
| Immigrants | Cambodia | 2.7 /100 | #223 | Tragic 44.9% |
| Immigrants | Micronesia | 2.6 /100 | #224 | Tragic 44.9% |
| Dutch West Indians | 2.6 /100 | #225 | Tragic 44.9% |
| Alsatians | 2.3 /100 | #226 | Tragic 44.8% |
| Salvadorans | 1.9 /100 | #227 | Tragic 44.7% |
| Kenyans | 1.7 /100 | #228 | Tragic 44.7% |
| Immigrants | Latin America | 1.6 /100 | #229 | Tragic 44.7% |
| Soviet Union | 1.6 /100 | #230 | Tragic 44.6% |
| Houma | 1.5 /100 | #231 | Tragic 44.6% |
| Marshallese | 1.5 /100 | #232 | Tragic 44.6% |
| Immigrants | Uganda | 1.5 /100 | #233 | Tragic 44.6% |
| Immigrants | Panama | 1.3 /100 | #234 | Tragic 44.6% |
| Immigrants | Nicaragua | 1.2 /100 | #235 | Tragic 44.5% |
| Yaqui | 1.2 /100 | #236 | Tragic 44.5% |
| Comanche | 1.2 /100 | #237 | Tragic 44.5% |