Immigrants from North America vs Eastern European Married-couple Households
COMPARE
Immigrants from North America
Eastern European
Married-couple Households
Married-couple Households Comparison
Immigrants from North America
Eastern Europeans
48.4%
MARRIED-COUPLE HOUSEHOLDS
98.9/ 100
METRIC RATING
70th/ 347
METRIC RANK
48.6%
MARRIED-COUPLE HOUSEHOLDS
99.3/ 100
METRIC RATING
51st/ 347
METRIC RANK
Immigrants from North America vs Eastern European Married-couple Households Correlation Chart
The statistical analysis conducted on geographies consisting of 462,174,767 people shows a poor positive correlation between the proportion of Immigrants from North America and percentage of married-couple family households in the United States with a correlation coefficient (R) of 0.150 and weighted average of 48.4%. Similarly, the statistical analysis conducted on geographies consisting of 460,944,660 people shows a poor positive correlation between the proportion of Eastern Europeans and percentage of married-couple family households in the United States with a correlation coefficient (R) of 0.137 and weighted average of 48.6%, a difference of 0.51%.
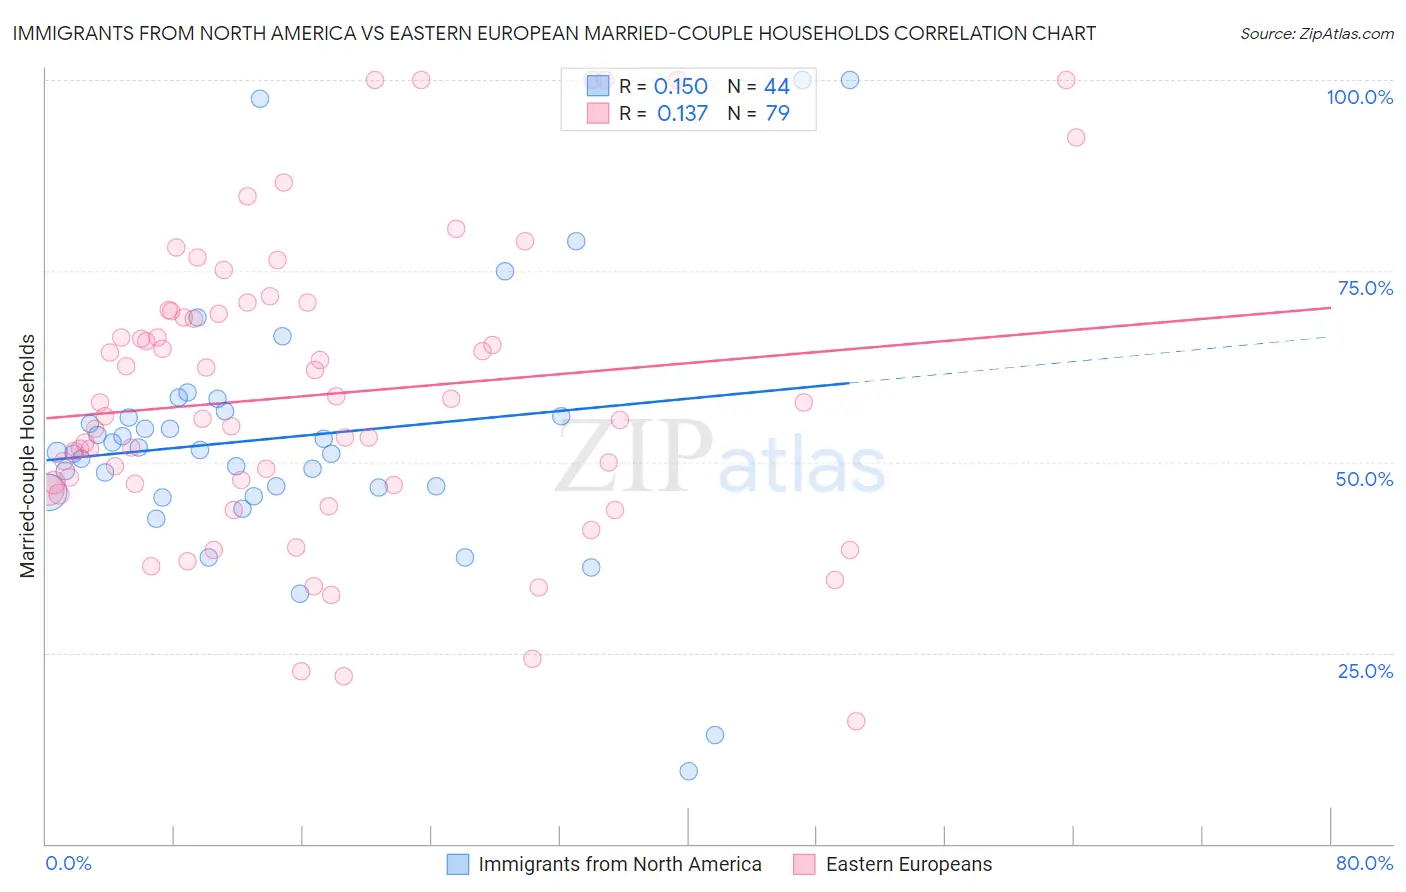
Married-couple Households Correlation Summary
| Measurement | Immigrants from North America | Eastern European |
| Minimum | 9.5% | 16.0% |
| Maximum | 100.0% | 100.0% |
| Range | 90.5% | 84.0% |
| Mean | 53.2% | 58.8% |
| Median | 51.3% | 55.9% |
| Interquartile 25% (IQ1) | 46.3% | 47.0% |
| Interquartile 75% (IQ3) | 56.3% | 69.8% |
| Interquartile Range (IQR) | 10.0% | 22.8% |
| Standard Deviation (Sample) | 17.6% | 19.4% |
| Standard Deviation (Population) | 17.3% | 19.3% |
Demographics Similar to Immigrants from North America and Eastern Europeans by Married-couple Households
In terms of married-couple households, the demographic groups most similar to Immigrants from North America are Immigrants from South Eastern Asia (48.4%, a difference of 0.040%), Immigrants from China (48.4%, a difference of 0.040%), Jordanian (48.4%, a difference of 0.060%), Romanian (48.4%, a difference of 0.060%), and Immigrants from Canada (48.4%, a difference of 0.090%). Similarly, the demographic groups most similar to Eastern Europeans are Samoan (48.7%, a difference of 0.040%), Irish (48.6%, a difference of 0.040%), White/Caucasian (48.6%, a difference of 0.090%), Immigrants from Lithuania (48.6%, a difference of 0.090%), and Austrian (48.6%, a difference of 0.10%).
| Demographics | Rating | Rank | Married-couple Households |
| Samoans | 99.4 /100 | #50 | Exceptional 48.7% |
| Eastern Europeans | 99.3 /100 | #51 | Exceptional 48.6% |
| Irish | 99.3 /100 | #52 | Exceptional 48.6% |
| Whites/Caucasians | 99.3 /100 | #53 | Exceptional 48.6% |
| Immigrants | Lithuania | 99.3 /100 | #54 | Exceptional 48.6% |
| Austrians | 99.3 /100 | #55 | Exceptional 48.6% |
| Immigrants | Northern Europe | 99.3 /100 | #56 | Exceptional 48.6% |
| Poles | 99.2 /100 | #57 | Exceptional 48.5% |
| Immigrants | Indonesia | 99.2 /100 | #58 | Exceptional 48.5% |
| Czechoslovakians | 99.2 /100 | #59 | Exceptional 48.5% |
| Croatians | 99.1 /100 | #60 | Exceptional 48.5% |
| Bulgarians | 99.1 /100 | #61 | Exceptional 48.5% |
| Luxembourgers | 99.1 /100 | #62 | Exceptional 48.5% |
| Basques | 99.0 /100 | #63 | Exceptional 48.4% |
| Northern Europeans | 99.0 /100 | #64 | Exceptional 48.4% |
| Immigrants | Canada | 99.0 /100 | #65 | Exceptional 48.4% |
| Jordanians | 98.9 /100 | #66 | Exceptional 48.4% |
| Romanians | 98.9 /100 | #67 | Exceptional 48.4% |
| Immigrants | South Eastern Asia | 98.9 /100 | #68 | Exceptional 48.4% |
| Immigrants | China | 98.9 /100 | #69 | Exceptional 48.4% |
| Immigrants | North America | 98.9 /100 | #70 | Exceptional 48.4% |