Central American vs French Married-couple Households
COMPARE
Central American
French
Married-couple Households
Married-couple Households Comparison
Central Americans
French
43.9%
MARRIED-COUPLE HOUSEHOLDS
0.3/ 100
METRIC RATING
253rd/ 347
METRIC RANK
48.0%
MARRIED-COUPLE HOUSEHOLDS
97.2/ 100
METRIC RATING
90th/ 347
METRIC RANK
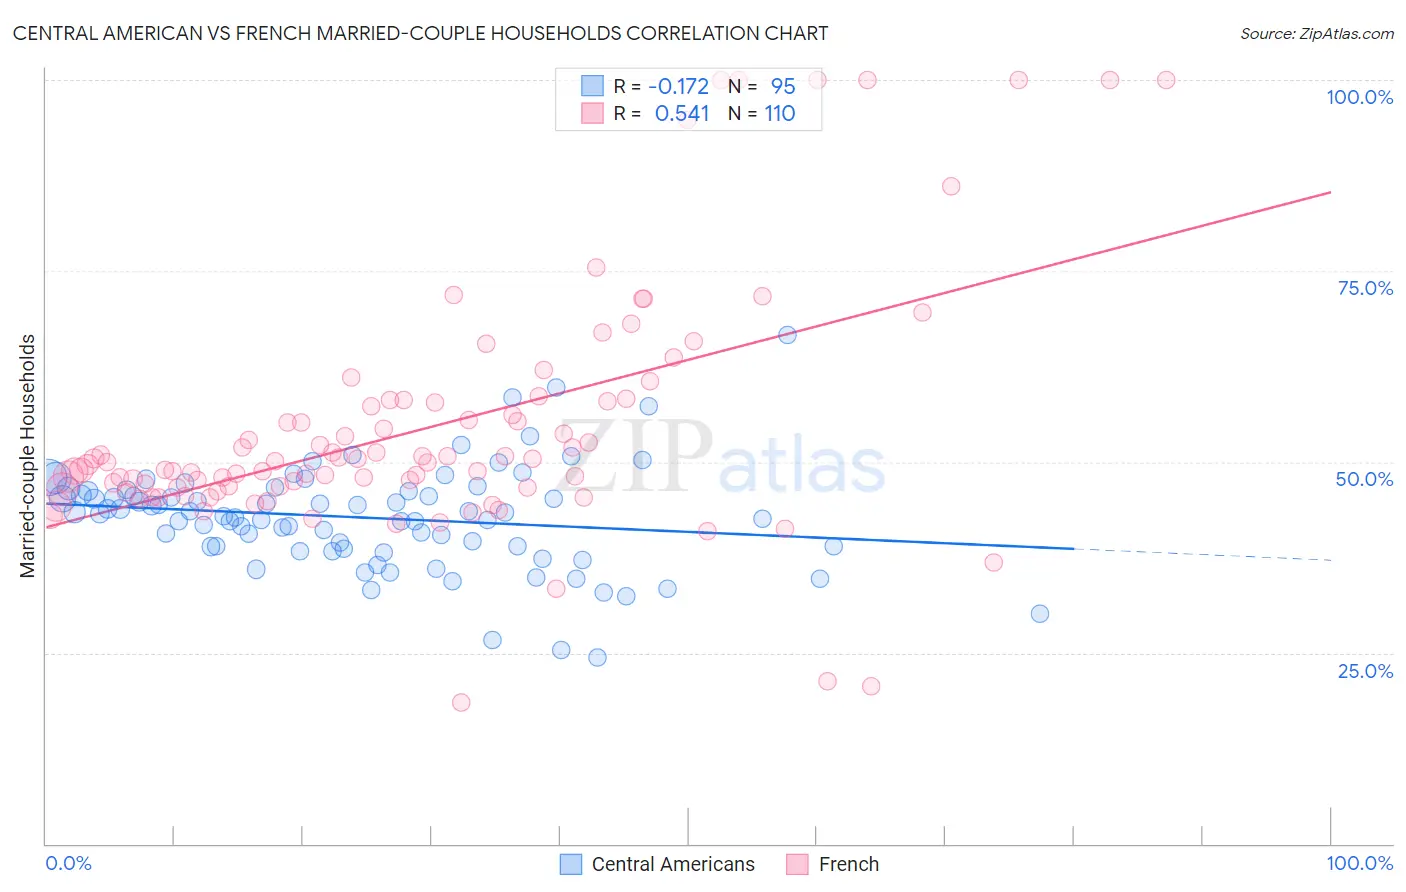
Central American vs French Married-couple Households Correlation Chart
The statistical analysis conducted on geographies consisting of 504,046,022 people shows a poor negative correlation between the proportion of Central Americans and percentage of married-couple family households in the United States with a correlation coefficient (R) of -0.172 and weighted average of 43.9%. Similarly, the statistical analysis conducted on geographies consisting of 571,775,805 people shows a substantial positive correlation between the proportion of French and percentage of married-couple family households in the United States with a correlation coefficient (R) of 0.541 and weighted average of 48.0%, a difference of 9.2%.
Married-couple Households Correlation Summary
| Measurement | Central American | French |
| Minimum | 24.4% | 18.5% |
| Maximum | 66.7% | 100.0% |
| Range | 42.3% | 81.5% |
| Mean | 42.7% | 54.4% |
| Median | 43.2% | 49.9% |
| Interquartile 25% (IQ1) | 38.9% | 46.7% |
| Interquartile 75% (IQ3) | 46.2% | 57.9% |
| Interquartile Range (IQR) | 7.3% | 11.2% |
| Standard Deviation (Sample) | 6.8% | 16.0% |
| Standard Deviation (Population) | 6.8% | 15.9% |
Similar Demographics by Married-couple Households
Demographics Similar to Central Americans by Married-couple Households
In terms of married-couple households, the demographic groups most similar to Central Americans are Apache (43.9%, a difference of 0.050%), Shoshone (43.9%, a difference of 0.070%), Seminole (44.0%, a difference of 0.12%), German Russian (44.0%, a difference of 0.19%), and Ugandan (43.8%, a difference of 0.21%).
| Demographics | Rating | Rank | Married-couple Households |
| Immigrants | Cuba | 0.6 /100 | #246 | Tragic 44.2% |
| Immigrants | Morocco | 0.6 /100 | #247 | Tragic 44.2% |
| Yup'ik | 0.4 /100 | #248 | Tragic 44.1% |
| Immigrants | Kenya | 0.4 /100 | #249 | Tragic 44.1% |
| French American Indians | 0.4 /100 | #250 | Tragic 44.1% |
| German Russians | 0.4 /100 | #251 | Tragic 44.0% |
| Seminole | 0.4 /100 | #252 | Tragic 44.0% |
| Central Americans | 0.3 /100 | #253 | Tragic 43.9% |
| Apache | 0.3 /100 | #254 | Tragic 43.9% |
| Shoshone | 0.3 /100 | #255 | Tragic 43.9% |
| Ugandans | 0.3 /100 | #256 | Tragic 43.8% |
| Blackfeet | 0.2 /100 | #257 | Tragic 43.8% |
| Central American Indians | 0.2 /100 | #258 | Tragic 43.8% |
| Iroquois | 0.2 /100 | #259 | Tragic 43.7% |
| Immigrants | Cameroon | 0.2 /100 | #260 | Tragic 43.7% |
Demographics Similar to French by Married-couple Households
In terms of married-couple households, the demographic groups most similar to French are Cypriot (48.0%, a difference of 0.010%), Afghan (48.0%, a difference of 0.040%), Immigrants from Ireland (48.0%, a difference of 0.050%), Belgian (48.0%, a difference of 0.060%), and Immigrants from Moldova (48.0%, a difference of 0.060%).
| Demographics | Rating | Rank | Married-couple Households |
| Guamanians/Chamorros | 97.6 /100 | #83 | Exceptional 48.1% |
| Ukrainians | 97.6 /100 | #84 | Exceptional 48.1% |
| Immigrants | Israel | 97.4 /100 | #85 | Exceptional 48.0% |
| Belgians | 97.4 /100 | #86 | Exceptional 48.0% |
| Immigrants | Ireland | 97.3 /100 | #87 | Exceptional 48.0% |
| Afghans | 97.3 /100 | #88 | Exceptional 48.0% |
| Cypriots | 97.2 /100 | #89 | Exceptional 48.0% |
| French | 97.2 /100 | #90 | Exceptional 48.0% |
| Immigrants | Moldova | 97.0 /100 | #91 | Exceptional 48.0% |
| Palestinians | 96.9 /100 | #92 | Exceptional 48.0% |
| Lebanese | 96.9 /100 | #93 | Exceptional 47.9% |
| Americans | 96.9 /100 | #94 | Exceptional 47.9% |
| Immigrants | Belgium | 96.8 /100 | #95 | Exceptional 47.9% |
| Immigrants | Egypt | 96.6 /100 | #96 | Exceptional 47.9% |
| Latvians | 96.5 /100 | #97 | Exceptional 47.9% |