Immigrants from North America vs French Male Poverty
COMPARE
Immigrants from North America
French
Male Poverty
Male Poverty Comparison
Immigrants from North America
French
10.3%
MALE POVERTY
96.5/ 100
METRIC RATING
79th/ 347
METRIC RANK
10.7%
MALE POVERTY
86.7/ 100
METRIC RATING
124th/ 347
METRIC RANK
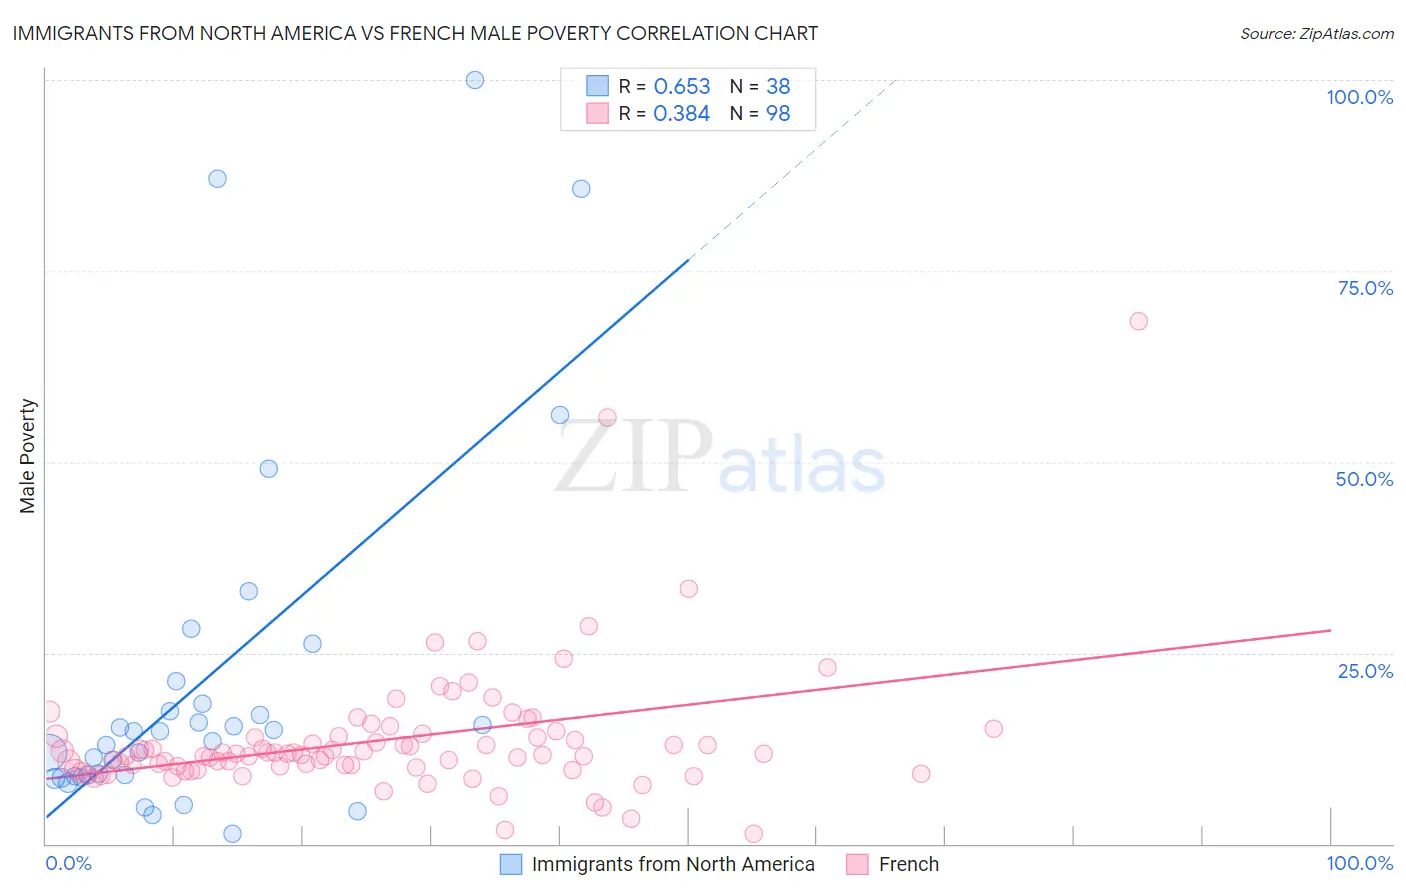
Immigrants from North America vs French Male Poverty Correlation Chart
The statistical analysis conducted on geographies consisting of 461,883,462 people shows a significant positive correlation between the proportion of Immigrants from North America and poverty level among males in the United States with a correlation coefficient (R) of 0.653 and weighted average of 10.3%. Similarly, the statistical analysis conducted on geographies consisting of 570,714,674 people shows a mild positive correlation between the proportion of French and poverty level among males in the United States with a correlation coefficient (R) of 0.384 and weighted average of 10.7%, a difference of 3.9%.
Male Poverty Correlation Summary
| Measurement | Immigrants from North America | French |
| Minimum | 1.3% | 1.3% |
| Maximum | 100.0% | 68.4% |
| Range | 98.8% | 67.2% |
| Mean | 21.2% | 13.6% |
| Median | 14.1% | 11.7% |
| Interquartile 25% (IQ1) | 8.9% | 9.9% |
| Interquartile 75% (IQ3) | 18.3% | 14.0% |
| Interquartile Range (IQR) | 9.5% | 4.1% |
| Standard Deviation (Sample) | 23.5% | 8.8% |
| Standard Deviation (Population) | 23.2% | 8.7% |
Similar Demographics by Male Poverty
Demographics Similar to Immigrants from North America by Male Poverty
In terms of male poverty, the demographic groups most similar to Immigrants from North America are English (10.3%, a difference of 0.080%), Irish (10.3%, a difference of 0.24%), Immigrants from Belgium (10.3%, a difference of 0.26%), Dutch (10.2%, a difference of 0.29%), and Immigrants from Eastern Europe (10.2%, a difference of 0.30%).
| Demographics | Rating | Rank | Male Poverty |
| Immigrants | Canada | 97.1 /100 | #72 | Exceptional 10.2% |
| Immigrants | Asia | 97.0 /100 | #73 | Exceptional 10.2% |
| Immigrants | Eastern Europe | 96.9 /100 | #74 | Exceptional 10.2% |
| Carpatho Rusyns | 96.9 /100 | #75 | Exceptional 10.2% |
| Dutch | 96.9 /100 | #76 | Exceptional 10.2% |
| Immigrants | Belgium | 96.8 /100 | #77 | Exceptional 10.3% |
| Irish | 96.8 /100 | #78 | Exceptional 10.3% |
| Immigrants | North America | 96.5 /100 | #79 | Exceptional 10.3% |
| English | 96.4 /100 | #80 | Exceptional 10.3% |
| Belgians | 95.9 /100 | #81 | Exceptional 10.3% |
| Egyptians | 95.9 /100 | #82 | Exceptional 10.3% |
| Immigrants | Sweden | 95.7 /100 | #83 | Exceptional 10.3% |
| Czechoslovakians | 95.6 /100 | #84 | Exceptional 10.3% |
| Immigrants | England | 95.5 /100 | #85 | Exceptional 10.4% |
| Immigrants | Eastern Asia | 95.3 /100 | #86 | Exceptional 10.4% |
Demographics Similar to French by Male Poverty
In terms of male poverty, the demographic groups most similar to French are South African (10.7%, a difference of 0.030%), Native Hawaiian (10.7%, a difference of 0.070%), Peruvian (10.7%, a difference of 0.080%), Immigrants from China (10.7%, a difference of 0.10%), and Immigrants from Norway (10.7%, a difference of 0.15%).
| Demographics | Rating | Rank | Male Poverty |
| Immigrants | South Eastern Asia | 88.1 /100 | #117 | Excellent 10.6% |
| Okinawans | 87.6 /100 | #118 | Excellent 10.7% |
| Immigrants | Hungary | 87.6 /100 | #119 | Excellent 10.7% |
| Immigrants | China | 87.1 /100 | #120 | Excellent 10.7% |
| Peruvians | 87.1 /100 | #121 | Excellent 10.7% |
| Native Hawaiians | 87.0 /100 | #122 | Excellent 10.7% |
| South Africans | 86.8 /100 | #123 | Excellent 10.7% |
| French | 86.7 /100 | #124 | Excellent 10.7% |
| Immigrants | Norway | 86.0 /100 | #125 | Excellent 10.7% |
| Immigrants | Ukraine | 84.3 /100 | #126 | Excellent 10.7% |
| Puget Sound Salish | 84.3 /100 | #127 | Excellent 10.7% |
| Immigrants | Western Europe | 84.2 /100 | #128 | Excellent 10.7% |
| Immigrants | Peru | 84.1 /100 | #129 | Excellent 10.7% |
| Chileans | 83.9 /100 | #130 | Excellent 10.7% |
| Immigrants | Belarus | 83.3 /100 | #131 | Excellent 10.7% |