Immigrants from Morocco vs Immigrants from Italy Family Households
COMPARE
Immigrants from Morocco
Immigrants from Italy
Family Households
Family Households Comparison
Immigrants from Morocco
Immigrants from Italy
62.0%
FAMILY HOUSEHOLDS
0.0/ 100
METRIC RATING
311th/ 347
METRIC RANK
64.8%
FAMILY HOUSEHOLDS
90.2/ 100
METRIC RATING
130th/ 347
METRIC RANK
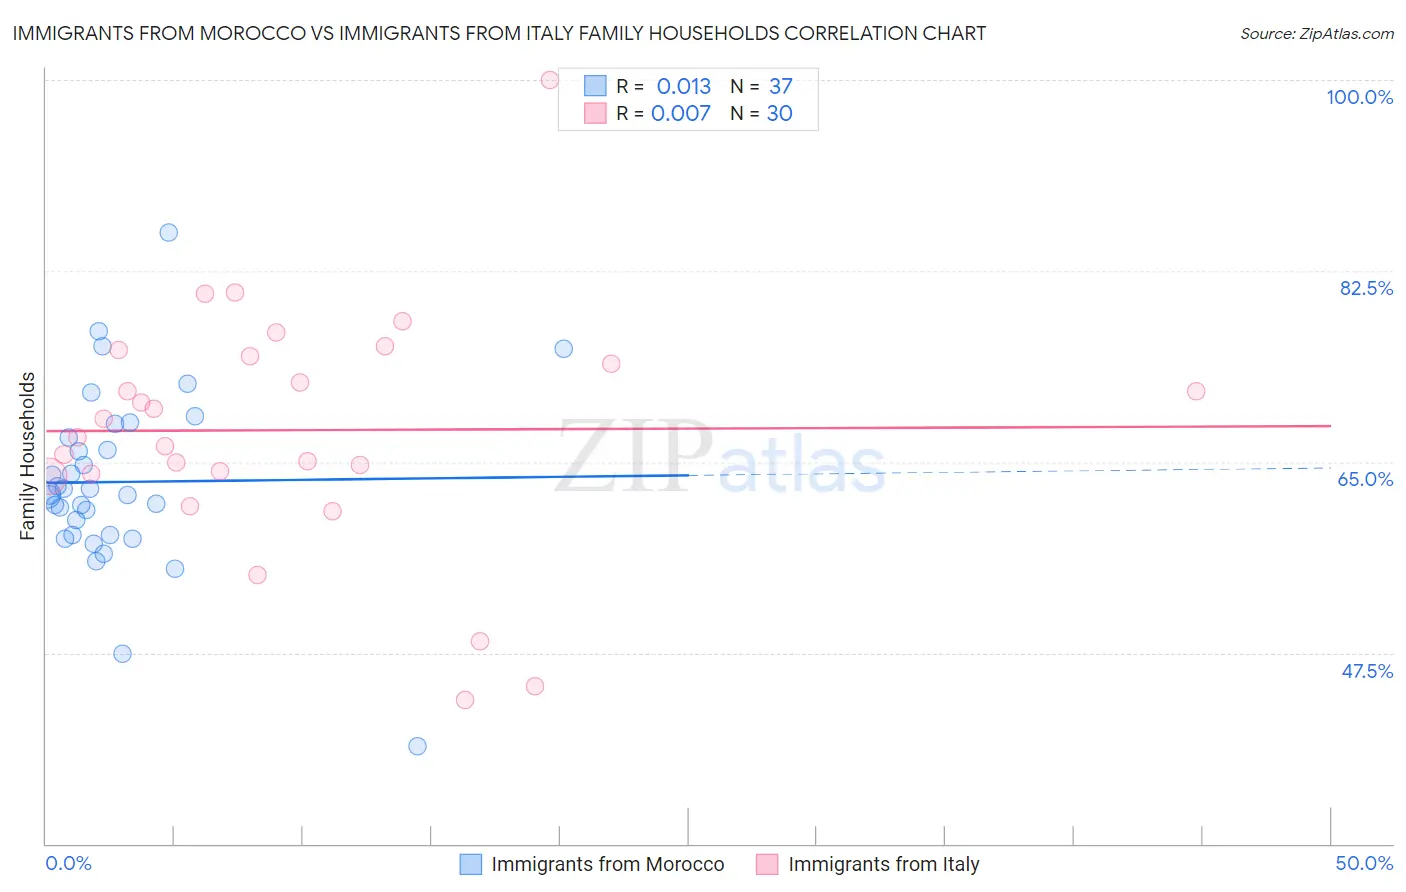
Immigrants from Morocco vs Immigrants from Italy Family Households Correlation Chart
The statistical analysis conducted on geographies consisting of 178,909,930 people shows no correlation between the proportion of Immigrants from Morocco and percentage of family households in the United States with a correlation coefficient (R) of 0.013 and weighted average of 62.0%. Similarly, the statistical analysis conducted on geographies consisting of 324,146,705 people shows no correlation between the proportion of Immigrants from Italy and percentage of family households in the United States with a correlation coefficient (R) of 0.007 and weighted average of 64.8%, a difference of 4.5%.
Family Households Correlation Summary
| Measurement | Immigrants from Morocco | Immigrants from Italy |
| Minimum | 38.9% | 43.1% |
| Maximum | 86.0% | 100.0% |
| Range | 47.1% | 56.9% |
| Mean | 63.2% | 67.9% |
| Median | 62.0% | 68.1% |
| Interquartile 25% (IQ1) | 58.2% | 63.9% |
| Interquartile 75% (IQ3) | 67.9% | 74.7% |
| Interquartile Range (IQR) | 9.6% | 10.7% |
| Standard Deviation (Sample) | 8.3% | 11.3% |
| Standard Deviation (Population) | 8.2% | 11.1% |
Similar Demographics by Family Households
Demographics Similar to Immigrants from Morocco by Family Households
In terms of family households, the demographic groups most similar to Immigrants from Morocco are Immigrants from Liberia (62.0%, a difference of 0.030%), Immigrants from Latvia (62.0%, a difference of 0.050%), Liberian (62.0%, a difference of 0.050%), Subsaharan African (62.1%, a difference of 0.070%), and Immigrants from Cabo Verde (61.9%, a difference of 0.10%).
| Demographics | Rating | Rank | Family Households |
| Iroquois | 0.0 /100 | #304 | Tragic 62.2% |
| Bermudans | 0.0 /100 | #305 | Tragic 62.2% |
| Africans | 0.0 /100 | #306 | Tragic 62.1% |
| Immigrants | Norway | 0.0 /100 | #307 | Tragic 62.1% |
| Chippewa | 0.0 /100 | #308 | Tragic 62.1% |
| Sub-Saharan Africans | 0.0 /100 | #309 | Tragic 62.1% |
| Immigrants | Liberia | 0.0 /100 | #310 | Tragic 62.0% |
| Immigrants | Morocco | 0.0 /100 | #311 | Tragic 62.0% |
| Immigrants | Latvia | 0.0 /100 | #312 | Tragic 62.0% |
| Liberians | 0.0 /100 | #313 | Tragic 62.0% |
| Immigrants | Cabo Verde | 0.0 /100 | #314 | Tragic 61.9% |
| Moroccans | 0.0 /100 | #315 | Tragic 61.9% |
| Immigrants | Middle Africa | 0.0 /100 | #316 | Tragic 61.9% |
| Immigrants | Bosnia and Herzegovina | 0.0 /100 | #317 | Tragic 61.9% |
| Alaskan Athabascans | 0.0 /100 | #318 | Tragic 61.8% |
Demographics Similar to Immigrants from Italy by Family Households
In terms of family households, the demographic groups most similar to Immigrants from Italy are Nonimmigrants (64.8%, a difference of 0.010%), Cajun (64.8%, a difference of 0.030%), Belizean (64.8%, a difference of 0.040%), Immigrants from Ecuador (64.8%, a difference of 0.050%), and Immigrants from Panama (64.8%, a difference of 0.070%).
| Demographics | Rating | Rank | Family Households |
| Choctaw | 93.4 /100 | #123 | Exceptional 64.9% |
| Immigrants | Argentina | 92.8 /100 | #124 | Exceptional 64.9% |
| Immigrants | Belize | 92.7 /100 | #125 | Exceptional 64.9% |
| Panamanians | 92.4 /100 | #126 | Exceptional 64.8% |
| Immigrants | Panama | 92.0 /100 | #127 | Exceptional 64.8% |
| Italians | 91.9 /100 | #128 | Exceptional 64.8% |
| Immigrants | Ecuador | 91.4 /100 | #129 | Exceptional 64.8% |
| Immigrants | Italy | 90.2 /100 | #130 | Exceptional 64.8% |
| Immigrants | Nonimmigrants | 90.1 /100 | #131 | Exceptional 64.8% |
| Cajuns | 89.4 /100 | #132 | Excellent 64.8% |
| Belizeans | 89.3 /100 | #133 | Excellent 64.8% |
| Greeks | 88.1 /100 | #134 | Excellent 64.7% |
| Maltese | 87.4 /100 | #135 | Excellent 64.7% |
| Immigrants | China | 86.6 /100 | #136 | Excellent 64.7% |
| Immigrants | Scotland | 86.4 /100 | #137 | Excellent 64.7% |