Cambodian vs Immigrants from Italy Family Households
COMPARE
Cambodian
Immigrants from Italy
Family Households
Family Households Comparison
Cambodians
Immigrants from Italy
61.4%
FAMILY HOUSEHOLDS
0.0/ 100
METRIC RATING
329th/ 347
METRIC RANK
64.8%
FAMILY HOUSEHOLDS
90.2/ 100
METRIC RATING
130th/ 347
METRIC RANK
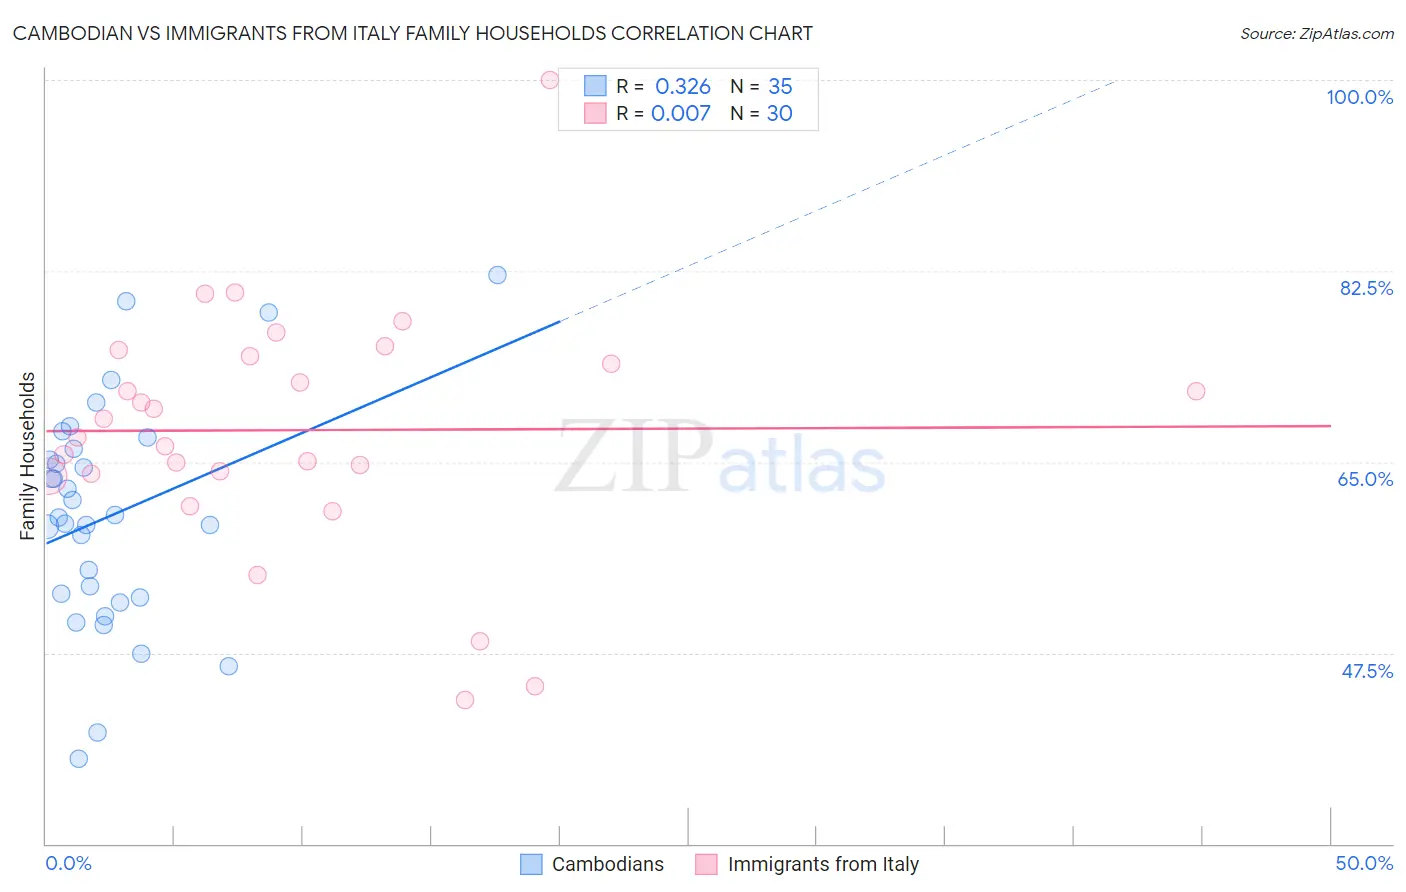
Cambodian vs Immigrants from Italy Family Households Correlation Chart
The statistical analysis conducted on geographies consisting of 102,469,130 people shows a mild positive correlation between the proportion of Cambodians and percentage of family households in the United States with a correlation coefficient (R) of 0.326 and weighted average of 61.4%. Similarly, the statistical analysis conducted on geographies consisting of 324,146,705 people shows no correlation between the proportion of Immigrants from Italy and percentage of family households in the United States with a correlation coefficient (R) of 0.007 and weighted average of 64.8%, a difference of 5.5%.
Family Households Correlation Summary
| Measurement | Cambodian | Immigrants from Italy |
| Minimum | 37.8% | 43.1% |
| Maximum | 82.2% | 100.0% |
| Range | 44.4% | 56.9% |
| Mean | 60.1% | 67.9% |
| Median | 59.9% | 68.1% |
| Interquartile 25% (IQ1) | 52.6% | 63.9% |
| Interquartile 75% (IQ3) | 66.2% | 74.7% |
| Interquartile Range (IQR) | 13.6% | 10.7% |
| Standard Deviation (Sample) | 10.2% | 11.3% |
| Standard Deviation (Population) | 10.1% | 11.1% |
Similar Demographics by Family Households
Demographics Similar to Cambodians by Family Households
In terms of family households, the demographic groups most similar to Cambodians are Kiowa (61.4%, a difference of 0.030%), Immigrants from Australia (61.3%, a difference of 0.14%), Immigrants from France (61.3%, a difference of 0.14%), Black/African American (61.5%, a difference of 0.15%), and Indonesian (61.5%, a difference of 0.18%).
| Demographics | Rating | Rank | Family Households |
| Immigrants | Serbia | 0.0 /100 | #322 | Tragic 61.6% |
| Tlingit-Haida | 0.0 /100 | #323 | Tragic 61.6% |
| Immigrants | West Indies | 0.0 /100 | #324 | Tragic 61.6% |
| Immigrants | Switzerland | 0.0 /100 | #325 | Tragic 61.6% |
| Indonesians | 0.0 /100 | #326 | Tragic 61.5% |
| Blacks/African Americans | 0.0 /100 | #327 | Tragic 61.5% |
| Kiowa | 0.0 /100 | #328 | Tragic 61.4% |
| Cambodians | 0.0 /100 | #329 | Tragic 61.4% |
| Immigrants | Australia | 0.0 /100 | #330 | Tragic 61.3% |
| Immigrants | France | 0.0 /100 | #331 | Tragic 61.3% |
| Ethiopians | 0.0 /100 | #332 | Tragic 61.2% |
| Immigrants | Ethiopia | 0.0 /100 | #333 | Tragic 61.2% |
| Immigrants | Eastern Africa | 0.0 /100 | #334 | Tragic 61.1% |
| Carpatho Rusyns | 0.0 /100 | #335 | Tragic 61.1% |
| German Russians | 0.0 /100 | #336 | Tragic 60.9% |
Demographics Similar to Immigrants from Italy by Family Households
In terms of family households, the demographic groups most similar to Immigrants from Italy are Nonimmigrants (64.8%, a difference of 0.010%), Cajun (64.8%, a difference of 0.030%), Belizean (64.8%, a difference of 0.040%), Immigrants from Ecuador (64.8%, a difference of 0.050%), and Immigrants from Panama (64.8%, a difference of 0.070%).
| Demographics | Rating | Rank | Family Households |
| Choctaw | 93.4 /100 | #123 | Exceptional 64.9% |
| Immigrants | Argentina | 92.8 /100 | #124 | Exceptional 64.9% |
| Immigrants | Belize | 92.7 /100 | #125 | Exceptional 64.9% |
| Panamanians | 92.4 /100 | #126 | Exceptional 64.8% |
| Immigrants | Panama | 92.0 /100 | #127 | Exceptional 64.8% |
| Italians | 91.9 /100 | #128 | Exceptional 64.8% |
| Immigrants | Ecuador | 91.4 /100 | #129 | Exceptional 64.8% |
| Immigrants | Italy | 90.2 /100 | #130 | Exceptional 64.8% |
| Immigrants | Nonimmigrants | 90.1 /100 | #131 | Exceptional 64.8% |
| Cajuns | 89.4 /100 | #132 | Excellent 64.8% |
| Belizeans | 89.3 /100 | #133 | Excellent 64.8% |
| Greeks | 88.1 /100 | #134 | Excellent 64.7% |
| Maltese | 87.4 /100 | #135 | Excellent 64.7% |
| Immigrants | China | 86.6 /100 | #136 | Excellent 64.7% |
| Immigrants | Scotland | 86.4 /100 | #137 | Excellent 64.7% |