Immigrants from Morocco vs Mongolian Family Households
COMPARE
Immigrants from Morocco
Mongolian
Family Households
Family Households Comparison
Immigrants from Morocco
Mongolians
62.0%
FAMILY HOUSEHOLDS
0.0/ 100
METRIC RATING
311th/ 347
METRIC RANK
62.8%
FAMILY HOUSEHOLDS
0.1/ 100
METRIC RATING
285th/ 347
METRIC RANK
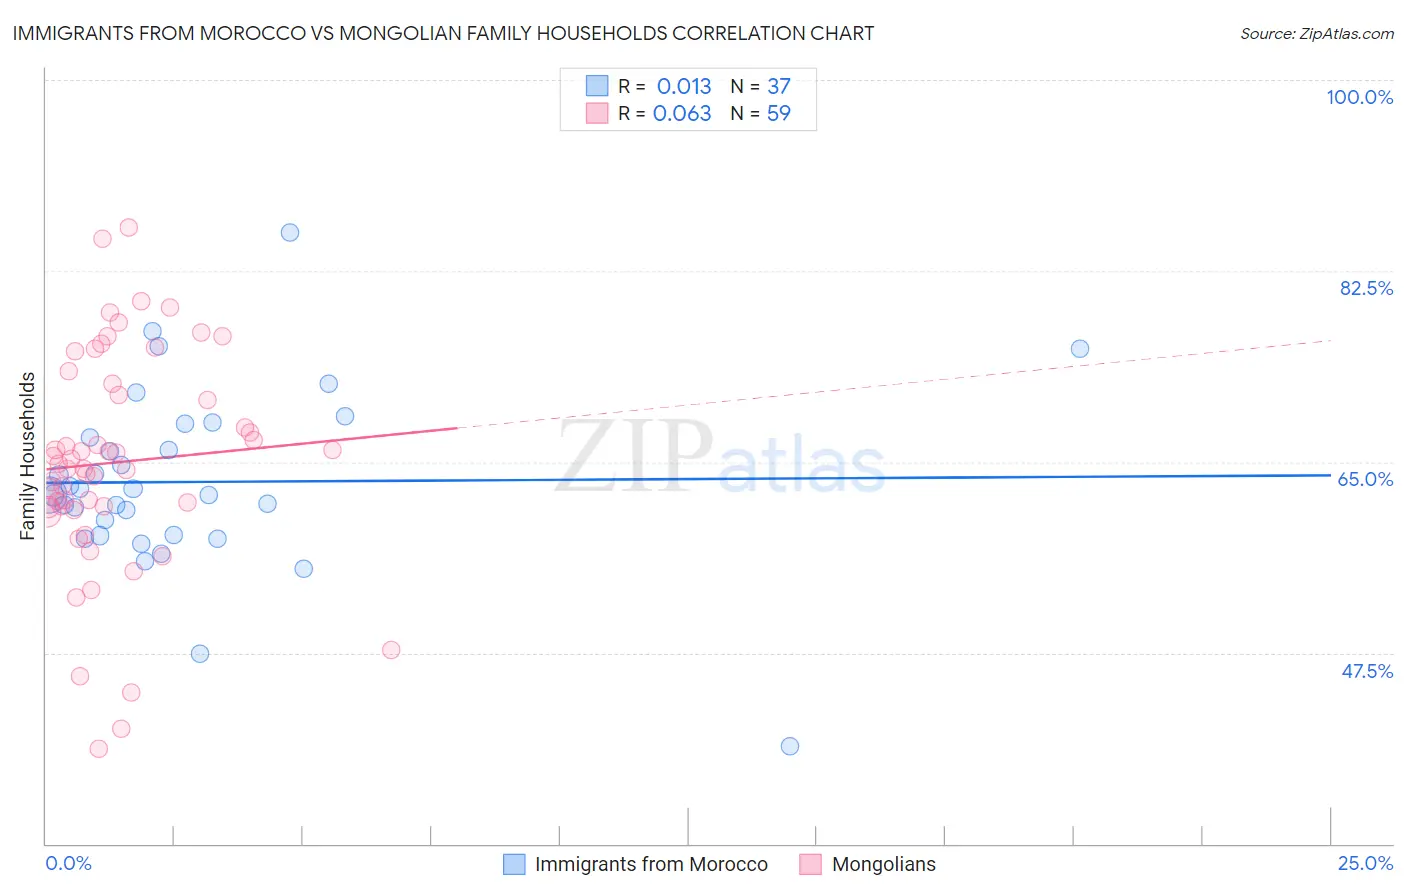
Immigrants from Morocco vs Mongolian Family Households Correlation Chart
The statistical analysis conducted on geographies consisting of 178,909,930 people shows no correlation between the proportion of Immigrants from Morocco and percentage of family households in the United States with a correlation coefficient (R) of 0.013 and weighted average of 62.0%. Similarly, the statistical analysis conducted on geographies consisting of 140,293,840 people shows a slight positive correlation between the proportion of Mongolians and percentage of family households in the United States with a correlation coefficient (R) of 0.063 and weighted average of 62.8%, a difference of 1.3%.
Family Households Correlation Summary
| Measurement | Immigrants from Morocco | Mongolian |
| Minimum | 38.9% | 38.8% |
| Maximum | 86.0% | 86.5% |
| Range | 47.1% | 47.8% |
| Mean | 63.2% | 65.0% |
| Median | 62.0% | 64.9% |
| Interquartile 25% (IQ1) | 58.2% | 60.9% |
| Interquartile 75% (IQ3) | 67.9% | 72.2% |
| Interquartile Range (IQR) | 9.6% | 11.3% |
| Standard Deviation (Sample) | 8.3% | 10.1% |
| Standard Deviation (Population) | 8.2% | 10.0% |
Similar Demographics by Family Households
Demographics Similar to Immigrants from Morocco by Family Households
In terms of family households, the demographic groups most similar to Immigrants from Morocco are Immigrants from Liberia (62.0%, a difference of 0.030%), Immigrants from Latvia (62.0%, a difference of 0.050%), Liberian (62.0%, a difference of 0.050%), Subsaharan African (62.1%, a difference of 0.070%), and Immigrants from Cabo Verde (61.9%, a difference of 0.10%).
| Demographics | Rating | Rank | Family Households |
| Iroquois | 0.0 /100 | #304 | Tragic 62.2% |
| Bermudans | 0.0 /100 | #305 | Tragic 62.2% |
| Africans | 0.0 /100 | #306 | Tragic 62.1% |
| Immigrants | Norway | 0.0 /100 | #307 | Tragic 62.1% |
| Chippewa | 0.0 /100 | #308 | Tragic 62.1% |
| Sub-Saharan Africans | 0.0 /100 | #309 | Tragic 62.1% |
| Immigrants | Liberia | 0.0 /100 | #310 | Tragic 62.0% |
| Immigrants | Morocco | 0.0 /100 | #311 | Tragic 62.0% |
| Immigrants | Latvia | 0.0 /100 | #312 | Tragic 62.0% |
| Liberians | 0.0 /100 | #313 | Tragic 62.0% |
| Immigrants | Cabo Verde | 0.0 /100 | #314 | Tragic 61.9% |
| Moroccans | 0.0 /100 | #315 | Tragic 61.9% |
| Immigrants | Middle Africa | 0.0 /100 | #316 | Tragic 61.9% |
| Immigrants | Bosnia and Herzegovina | 0.0 /100 | #317 | Tragic 61.9% |
| Alaskan Athabascans | 0.0 /100 | #318 | Tragic 61.8% |
Demographics Similar to Mongolians by Family Households
In terms of family households, the demographic groups most similar to Mongolians are British West Indian (62.8%, a difference of 0.030%), Latvian (62.8%, a difference of 0.030%), Immigrants from Uganda (62.7%, a difference of 0.050%), Australian (62.8%, a difference of 0.10%), and Immigrants from Nepal (62.7%, a difference of 0.14%).
| Demographics | Rating | Rank | Family Households |
| Immigrants | Belgium | 0.2 /100 | #278 | Tragic 63.0% |
| Immigrants | Yemen | 0.2 /100 | #279 | Tragic 63.0% |
| Immigrants | Bulgaria | 0.2 /100 | #280 | Tragic 63.0% |
| Estonians | 0.2 /100 | #281 | Tragic 62.9% |
| New Zealanders | 0.1 /100 | #282 | Tragic 62.9% |
| Immigrants | Denmark | 0.1 /100 | #283 | Tragic 62.9% |
| Australians | 0.1 /100 | #284 | Tragic 62.8% |
| Mongolians | 0.1 /100 | #285 | Tragic 62.8% |
| British West Indians | 0.1 /100 | #286 | Tragic 62.8% |
| Latvians | 0.1 /100 | #287 | Tragic 62.8% |
| Immigrants | Uganda | 0.1 /100 | #288 | Tragic 62.7% |
| Immigrants | Nepal | 0.1 /100 | #289 | Tragic 62.7% |
| Immigrants | Grenada | 0.0 /100 | #290 | Tragic 62.6% |
| U.S. Virgin Islanders | 0.0 /100 | #291 | Tragic 62.6% |
| Immigrants | Burma/Myanmar | 0.0 /100 | #292 | Tragic 62.6% |