Immigrants from Syria vs Immigrants from Italy Family Households
COMPARE
Immigrants from Syria
Immigrants from Italy
Family Households
Family Households Comparison
Immigrants from Syria
Immigrants from Italy
65.2%
FAMILY HOUSEHOLDS
98.4/ 100
METRIC RATING
98th/ 347
METRIC RANK
64.8%
FAMILY HOUSEHOLDS
90.2/ 100
METRIC RATING
130th/ 347
METRIC RANK
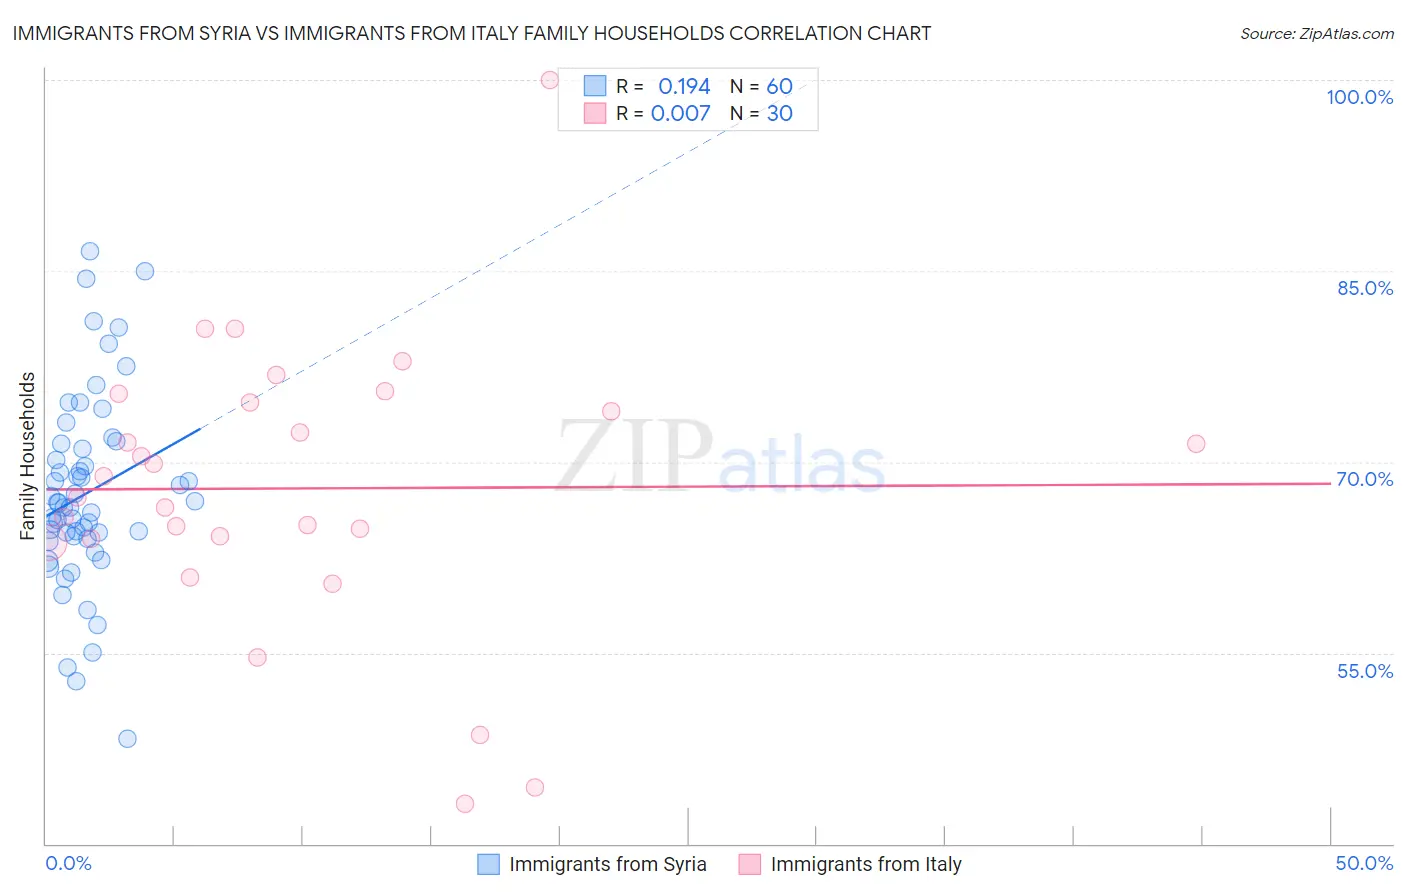
Immigrants from Syria vs Immigrants from Italy Family Households Correlation Chart
The statistical analysis conducted on geographies consisting of 174,105,874 people shows a poor positive correlation between the proportion of Immigrants from Syria and percentage of family households in the United States with a correlation coefficient (R) of 0.194 and weighted average of 65.2%. Similarly, the statistical analysis conducted on geographies consisting of 324,146,705 people shows no correlation between the proportion of Immigrants from Italy and percentage of family households in the United States with a correlation coefficient (R) of 0.007 and weighted average of 64.8%, a difference of 0.63%.
Family Households Correlation Summary
| Measurement | Immigrants from Syria | Immigrants from Italy |
| Minimum | 48.3% | 43.1% |
| Maximum | 86.5% | 100.0% |
| Range | 38.3% | 56.9% |
| Mean | 67.5% | 67.9% |
| Median | 66.6% | 68.1% |
| Interquartile 25% (IQ1) | 64.0% | 63.9% |
| Interquartile 75% (IQ3) | 71.2% | 74.7% |
| Interquartile Range (IQR) | 7.2% | 10.7% |
| Standard Deviation (Sample) | 7.6% | 11.3% |
| Standard Deviation (Population) | 7.5% | 11.1% |
Similar Demographics by Family Households
Demographics Similar to Immigrants from Syria by Family Households
In terms of family households, the demographic groups most similar to Immigrants from Syria are Central American Indian (65.2%, a difference of 0.020%), Swiss (65.2%, a difference of 0.040%), Guatemalan (65.2%, a difference of 0.040%), Immigrants from Portugal (65.2%, a difference of 0.050%), and Haitian (65.2%, a difference of 0.060%).
| Demographics | Rating | Rank | Family Households |
| Crow | 98.9 /100 | #91 | Exceptional 65.3% |
| Hopi | 98.8 /100 | #92 | Exceptional 65.3% |
| Guyanese | 98.8 /100 | #93 | Exceptional 65.3% |
| Immigrants | Poland | 98.7 /100 | #94 | Exceptional 65.2% |
| Immigrants | Portugal | 98.6 /100 | #95 | Exceptional 65.2% |
| Swiss | 98.6 /100 | #96 | Exceptional 65.2% |
| Guatemalans | 98.6 /100 | #97 | Exceptional 65.2% |
| Immigrants | Syria | 98.4 /100 | #98 | Exceptional 65.2% |
| Central American Indians | 98.3 /100 | #99 | Exceptional 65.2% |
| Haitians | 98.1 /100 | #100 | Exceptional 65.2% |
| Chileans | 98.1 /100 | #101 | Exceptional 65.2% |
| Immigrants | Sri Lanka | 98.0 /100 | #102 | Exceptional 65.1% |
| Indians (Asian) | 97.9 /100 | #103 | Exceptional 65.1% |
| Spaniards | 97.8 /100 | #104 | Exceptional 65.1% |
| English | 97.4 /100 | #105 | Exceptional 65.1% |
Demographics Similar to Immigrants from Italy by Family Households
In terms of family households, the demographic groups most similar to Immigrants from Italy are Nonimmigrants (64.8%, a difference of 0.010%), Cajun (64.8%, a difference of 0.030%), Belizean (64.8%, a difference of 0.040%), Immigrants from Ecuador (64.8%, a difference of 0.050%), and Immigrants from Panama (64.8%, a difference of 0.070%).
| Demographics | Rating | Rank | Family Households |
| Choctaw | 93.4 /100 | #123 | Exceptional 64.9% |
| Immigrants | Argentina | 92.8 /100 | #124 | Exceptional 64.9% |
| Immigrants | Belize | 92.7 /100 | #125 | Exceptional 64.9% |
| Panamanians | 92.4 /100 | #126 | Exceptional 64.8% |
| Immigrants | Panama | 92.0 /100 | #127 | Exceptional 64.8% |
| Italians | 91.9 /100 | #128 | Exceptional 64.8% |
| Immigrants | Ecuador | 91.4 /100 | #129 | Exceptional 64.8% |
| Immigrants | Italy | 90.2 /100 | #130 | Exceptional 64.8% |
| Immigrants | Nonimmigrants | 90.1 /100 | #131 | Exceptional 64.8% |
| Cajuns | 89.4 /100 | #132 | Excellent 64.8% |
| Belizeans | 89.3 /100 | #133 | Excellent 64.8% |
| Greeks | 88.1 /100 | #134 | Excellent 64.7% |
| Maltese | 87.4 /100 | #135 | Excellent 64.7% |
| Immigrants | China | 86.6 /100 | #136 | Excellent 64.7% |
| Immigrants | Scotland | 86.4 /100 | #137 | Excellent 64.7% |