Slovak vs Immigrants from Italy Family Households
COMPARE
Slovak
Immigrants from Italy
Family Households
Family Households Comparison
Slovaks
Immigrants from Italy
63.3%
FAMILY HOUSEHOLDS
1.0/ 100
METRIC RATING
254th/ 347
METRIC RANK
64.8%
FAMILY HOUSEHOLDS
90.2/ 100
METRIC RATING
130th/ 347
METRIC RANK
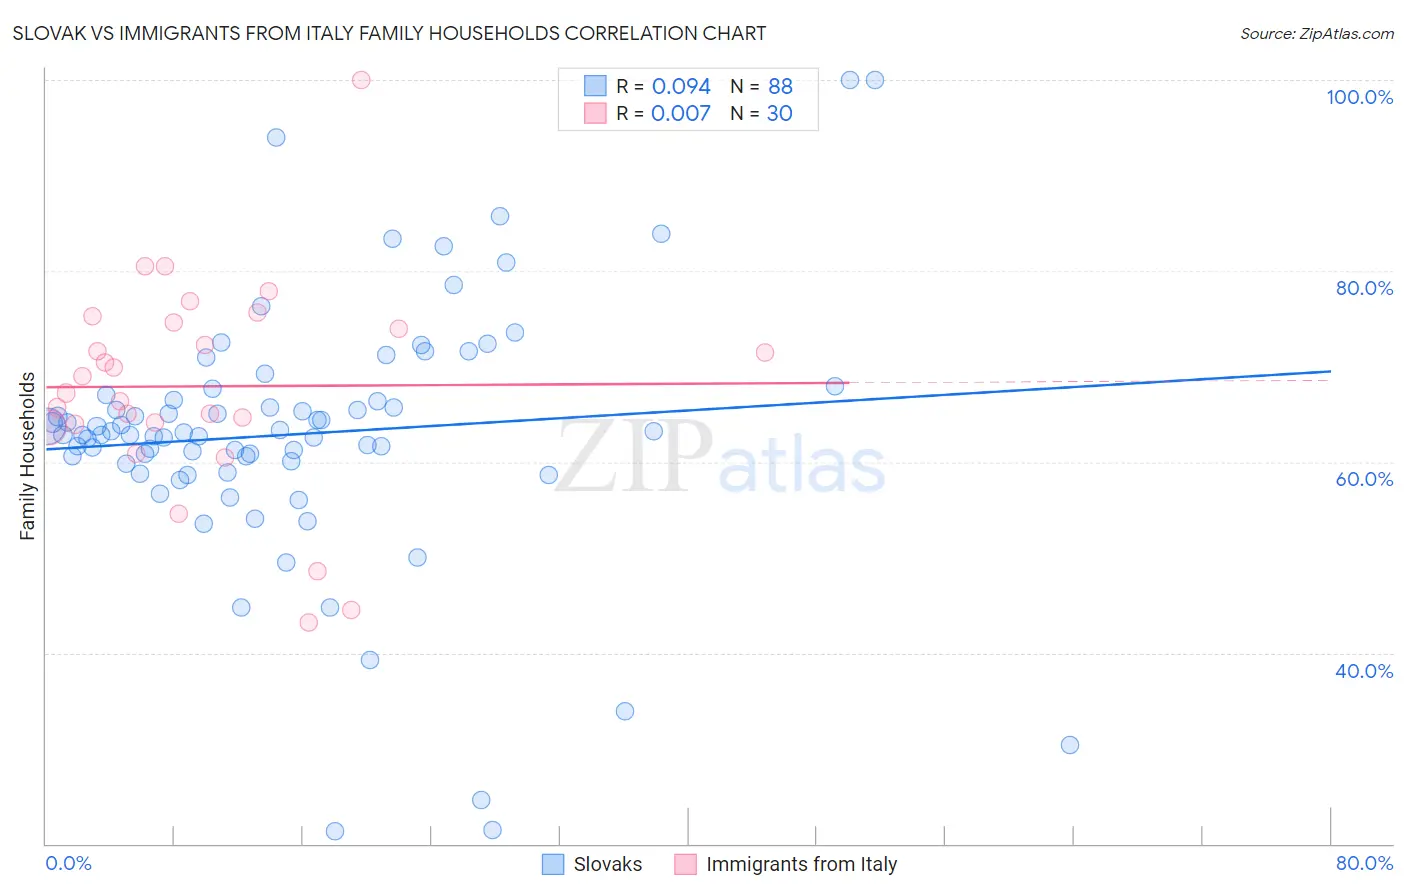
Slovak vs Immigrants from Italy Family Households Correlation Chart
The statistical analysis conducted on geographies consisting of 397,683,029 people shows a slight positive correlation between the proportion of Slovaks and percentage of family households in the United States with a correlation coefficient (R) of 0.094 and weighted average of 63.3%. Similarly, the statistical analysis conducted on geographies consisting of 324,146,705 people shows no correlation between the proportion of Immigrants from Italy and percentage of family households in the United States with a correlation coefficient (R) of 0.007 and weighted average of 64.8%, a difference of 2.3%.
Family Households Correlation Summary
| Measurement | Slovak | Immigrants from Italy |
| Minimum | 21.3% | 43.1% |
| Maximum | 100.0% | 100.0% |
| Range | 78.7% | 56.9% |
| Mean | 62.9% | 67.9% |
| Median | 63.0% | 68.1% |
| Interquartile 25% (IQ1) | 59.9% | 63.9% |
| Interquartile 75% (IQ3) | 66.7% | 74.7% |
| Interquartile Range (IQR) | 6.8% | 10.7% |
| Standard Deviation (Sample) | 13.6% | 11.3% |
| Standard Deviation (Population) | 13.5% | 11.1% |
Similar Demographics by Family Households
Demographics Similar to Slovaks by Family Households
In terms of family households, the demographic groups most similar to Slovaks are Immigrants from Dominican Republic (63.3%, a difference of 0.010%), Potawatomi (63.3%, a difference of 0.020%), Bahamian (63.3%, a difference of 0.030%), Taiwanese (63.3%, a difference of 0.040%), and Luxembourger (63.3%, a difference of 0.050%).
| Demographics | Rating | Rank | Family Households |
| Immigrants | Uzbekistan | 1.5 /100 | #247 | Tragic 63.4% |
| Dominicans | 1.5 /100 | #248 | Tragic 63.4% |
| Russians | 1.4 /100 | #249 | Tragic 63.4% |
| Immigrants | Japan | 1.4 /100 | #250 | Tragic 63.4% |
| Taiwanese | 1.2 /100 | #251 | Tragic 63.3% |
| Bahamians | 1.1 /100 | #252 | Tragic 63.3% |
| Immigrants | Dominican Republic | 1.0 /100 | #253 | Tragic 63.3% |
| Slovaks | 1.0 /100 | #254 | Tragic 63.3% |
| Potawatomi | 1.0 /100 | #255 | Tragic 63.3% |
| Luxembourgers | 0.9 /100 | #256 | Tragic 63.3% |
| Icelanders | 0.8 /100 | #257 | Tragic 63.3% |
| Immigrants | Barbados | 0.7 /100 | #258 | Tragic 63.2% |
| Immigrants | Western Europe | 0.6 /100 | #259 | Tragic 63.2% |
| Cypriots | 0.6 /100 | #260 | Tragic 63.2% |
| Immigrants | Russia | 0.6 /100 | #261 | Tragic 63.2% |
Demographics Similar to Immigrants from Italy by Family Households
In terms of family households, the demographic groups most similar to Immigrants from Italy are Nonimmigrants (64.8%, a difference of 0.010%), Cajun (64.8%, a difference of 0.030%), Belizean (64.8%, a difference of 0.040%), Immigrants from Ecuador (64.8%, a difference of 0.050%), and Immigrants from Panama (64.8%, a difference of 0.070%).
| Demographics | Rating | Rank | Family Households |
| Choctaw | 93.4 /100 | #123 | Exceptional 64.9% |
| Immigrants | Argentina | 92.8 /100 | #124 | Exceptional 64.9% |
| Immigrants | Belize | 92.7 /100 | #125 | Exceptional 64.9% |
| Panamanians | 92.4 /100 | #126 | Exceptional 64.8% |
| Immigrants | Panama | 92.0 /100 | #127 | Exceptional 64.8% |
| Italians | 91.9 /100 | #128 | Exceptional 64.8% |
| Immigrants | Ecuador | 91.4 /100 | #129 | Exceptional 64.8% |
| Immigrants | Italy | 90.2 /100 | #130 | Exceptional 64.8% |
| Immigrants | Nonimmigrants | 90.1 /100 | #131 | Exceptional 64.8% |
| Cajuns | 89.4 /100 | #132 | Excellent 64.8% |
| Belizeans | 89.3 /100 | #133 | Excellent 64.8% |
| Greeks | 88.1 /100 | #134 | Excellent 64.7% |
| Maltese | 87.4 /100 | #135 | Excellent 64.7% |
| Immigrants | China | 86.6 /100 | #136 | Excellent 64.7% |
| Immigrants | Scotland | 86.4 /100 | #137 | Excellent 64.7% |