Immigrants from Latvia vs Jamaican Bachelor's Degree
COMPARE
Immigrants from Latvia
Jamaican
Bachelor's Degree
Bachelor's Degree Comparison
Immigrants from Latvia
Jamaicans
45.1%
BACHELOR'S DEGREE
100.0/ 100
METRIC RATING
39th/ 347
METRIC RANK
33.6%
BACHELOR'S DEGREE
1.0/ 100
METRIC RATING
246th/ 347
METRIC RANK
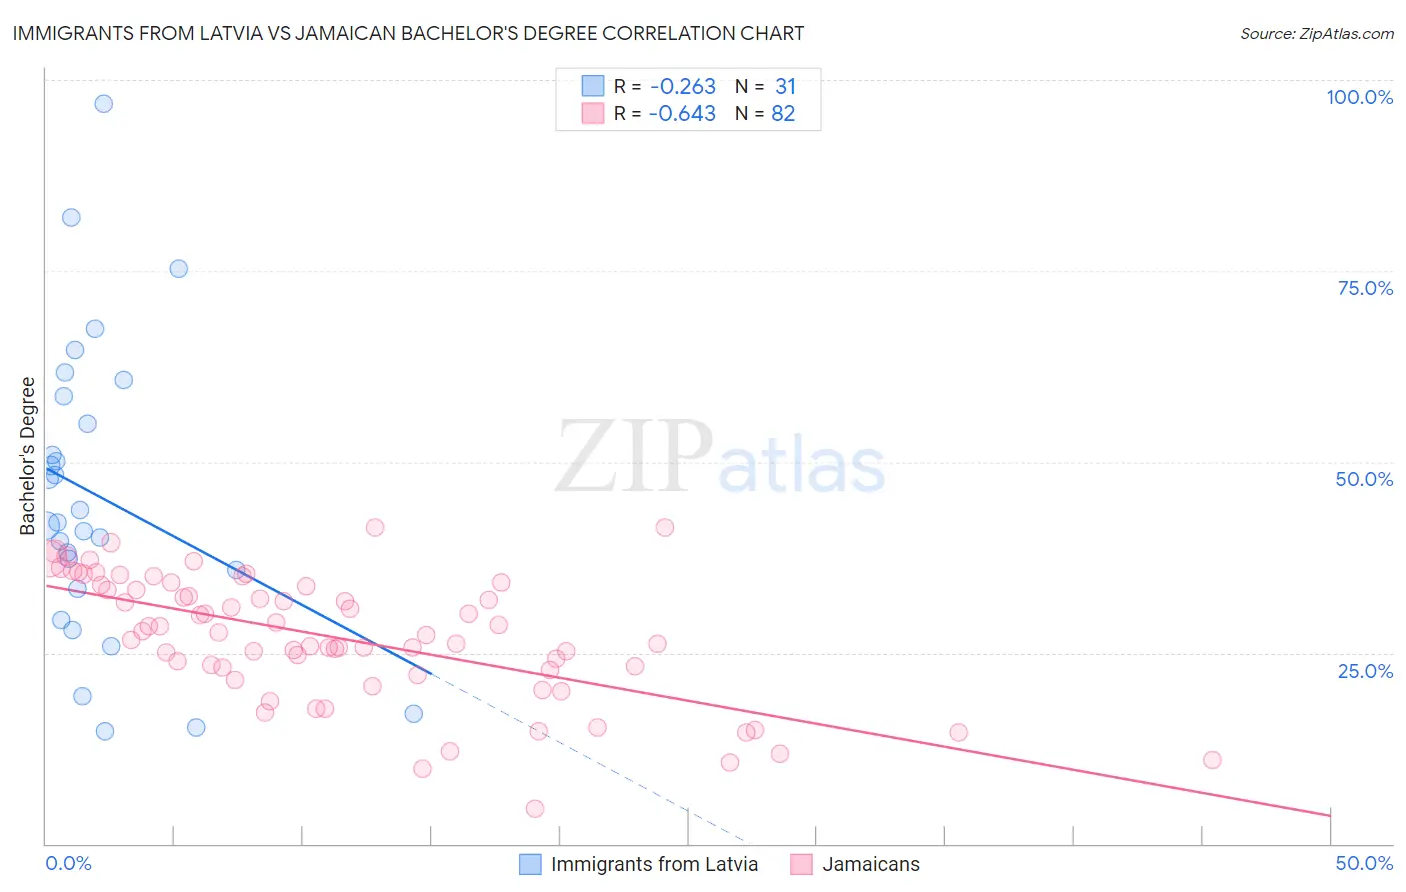
Immigrants from Latvia vs Jamaican Bachelor's Degree Correlation Chart
The statistical analysis conducted on geographies consisting of 113,735,345 people shows a weak negative correlation between the proportion of Immigrants from Latvia and percentage of population with at least bachelor's degree education in the United States with a correlation coefficient (R) of -0.263 and weighted average of 45.1%. Similarly, the statistical analysis conducted on geographies consisting of 368,011,400 people shows a significant negative correlation between the proportion of Jamaicans and percentage of population with at least bachelor's degree education in the United States with a correlation coefficient (R) of -0.643 and weighted average of 33.6%, a difference of 34.3%.
Bachelor's Degree Correlation Summary
| Measurement | Immigrants from Latvia | Jamaican |
| Minimum | 14.7% | 4.5% |
| Maximum | 96.9% | 41.5% |
| Range | 82.2% | 37.0% |
| Mean | 45.5% | 27.0% |
| Median | 42.0% | 27.5% |
| Interquartile 25% (IQ1) | 33.3% | 22.7% |
| Interquartile 75% (IQ3) | 58.6% | 33.7% |
| Interquartile Range (IQR) | 25.3% | 11.0% |
| Standard Deviation (Sample) | 19.4% | 8.2% |
| Standard Deviation (Population) | 19.1% | 8.1% |
Similar Demographics by Bachelor's Degree
Demographics Similar to Immigrants from Latvia by Bachelor's Degree
In terms of bachelor's degree, the demographic groups most similar to Immigrants from Latvia are Immigrants from Belarus (45.0%, a difference of 0.27%), Immigrants from Malaysia (45.0%, a difference of 0.31%), Bulgarian (45.3%, a difference of 0.33%), Russian (45.3%, a difference of 0.42%), and Mongolian (45.4%, a difference of 0.57%).
| Demographics | Rating | Rank | Bachelor's Degree |
| Immigrants | Turkey | 100.0 /100 | #32 | Exceptional 46.0% |
| Immigrants | Northern Europe | 100.0 /100 | #33 | Exceptional 45.6% |
| Immigrants | Denmark | 100.0 /100 | #34 | Exceptional 45.4% |
| Immigrants | Russia | 100.0 /100 | #35 | Exceptional 45.4% |
| Mongolians | 100.0 /100 | #36 | Exceptional 45.4% |
| Russians | 100.0 /100 | #37 | Exceptional 45.3% |
| Bulgarians | 100.0 /100 | #38 | Exceptional 45.3% |
| Immigrants | Latvia | 100.0 /100 | #39 | Exceptional 45.1% |
| Immigrants | Belarus | 100.0 /100 | #40 | Exceptional 45.0% |
| Immigrants | Malaysia | 100.0 /100 | #41 | Exceptional 45.0% |
| Immigrants | Saudi Arabia | 100.0 /100 | #42 | Exceptional 44.8% |
| Immigrants | South Africa | 99.9 /100 | #43 | Exceptional 44.8% |
| Immigrants | Lithuania | 99.9 /100 | #44 | Exceptional 44.6% |
| Immigrants | Kuwait | 99.9 /100 | #45 | Exceptional 44.6% |
| Immigrants | Bulgaria | 99.9 /100 | #46 | Exceptional 44.6% |
Demographics Similar to Jamaicans by Bachelor's Degree
In terms of bachelor's degree, the demographic groups most similar to Jamaicans are Immigrants from Congo (33.6%, a difference of 0.090%), Cree (33.6%, a difference of 0.10%), Immigrants from Liberia (33.5%, a difference of 0.23%), Indonesian (33.5%, a difference of 0.24%), and Immigrants from Fiji (33.7%, a difference of 0.36%).
| Demographics | Rating | Rank | Bachelor's Degree |
| British West Indians | 2.5 /100 | #239 | Tragic 34.5% |
| Tongans | 2.0 /100 | #240 | Tragic 34.3% |
| Immigrants | Cambodia | 1.9 /100 | #241 | Tragic 34.2% |
| Immigrants | Nonimmigrants | 1.8 /100 | #242 | Tragic 34.2% |
| Immigrants | Guyana | 1.4 /100 | #243 | Tragic 33.9% |
| Delaware | 1.2 /100 | #244 | Tragic 33.8% |
| Immigrants | Fiji | 1.2 /100 | #245 | Tragic 33.7% |
| Jamaicans | 1.0 /100 | #246 | Tragic 33.6% |
| Immigrants | Congo | 1.0 /100 | #247 | Tragic 33.6% |
| Cree | 1.0 /100 | #248 | Tragic 33.6% |
| Immigrants | Liberia | 0.9 /100 | #249 | Tragic 33.5% |
| Indonesians | 0.9 /100 | #250 | Tragic 33.5% |
| Japanese | 0.7 /100 | #251 | Tragic 33.3% |
| Immigrants | Bahamas | 0.7 /100 | #252 | Tragic 33.3% |
| U.S. Virgin Islanders | 0.7 /100 | #253 | Tragic 33.2% |