Immigrants from Central America vs Jamaican Family Households
COMPARE
Immigrants from Central America
Jamaican
Family Households
Family Households Comparison
Immigrants from Central America
Jamaicans
68.3%
FAMILY HOUSEHOLDS
100.0/ 100
METRIC RATING
11th/ 347
METRIC RANK
64.2%
FAMILY HOUSEHOLDS
40.6/ 100
METRIC RATING
178th/ 347
METRIC RANK
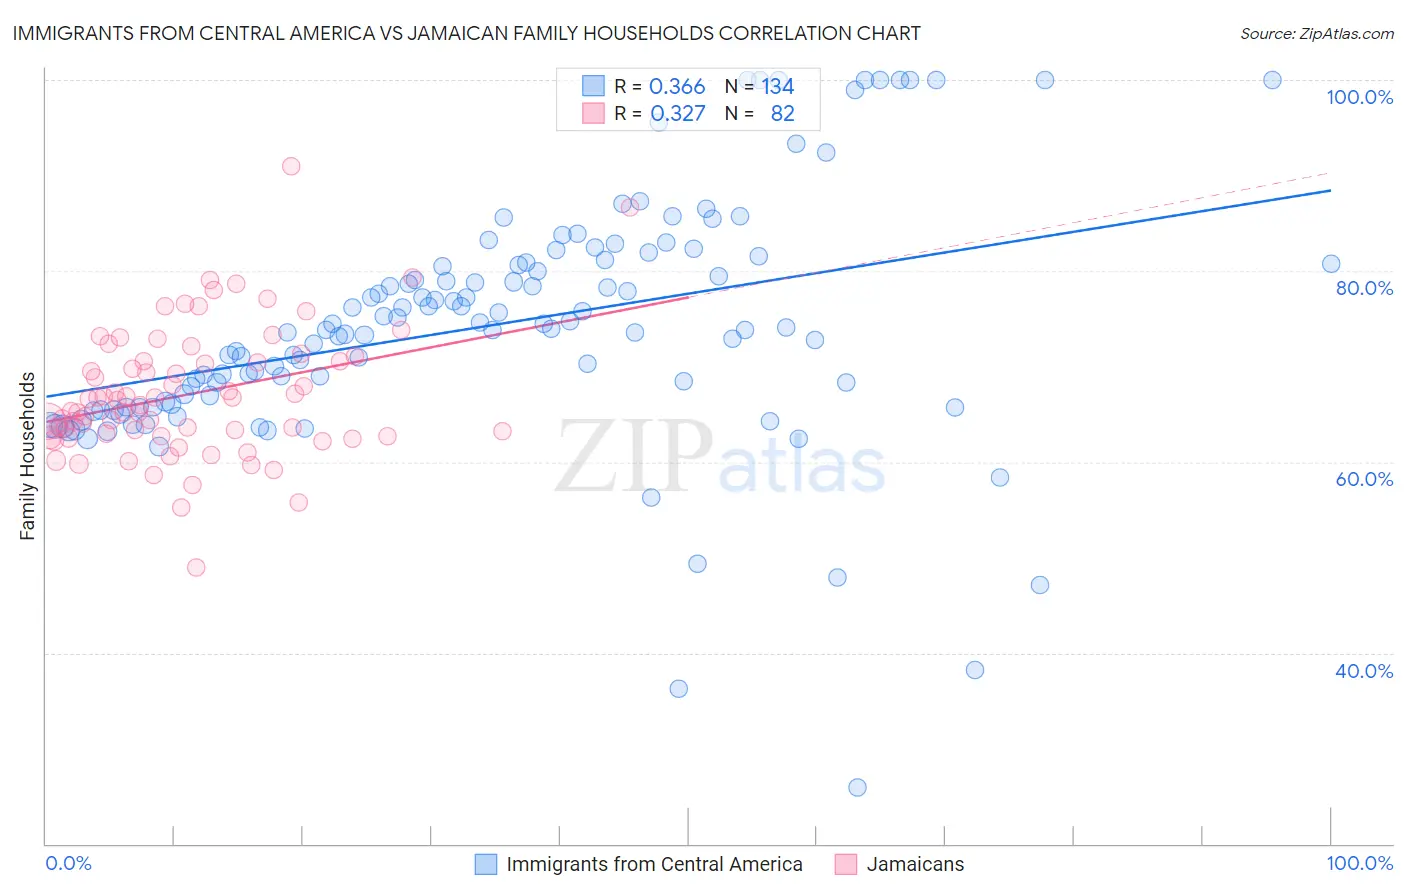
Immigrants from Central America vs Jamaican Family Households Correlation Chart
The statistical analysis conducted on geographies consisting of 536,086,114 people shows a mild positive correlation between the proportion of Immigrants from Central America and percentage of family households in the United States with a correlation coefficient (R) of 0.366 and weighted average of 68.3%. Similarly, the statistical analysis conducted on geographies consisting of 367,646,383 people shows a mild positive correlation between the proportion of Jamaicans and percentage of family households in the United States with a correlation coefficient (R) of 0.327 and weighted average of 64.2%, a difference of 6.3%.
Family Households Correlation Summary
| Measurement | Immigrants from Central America | Jamaican |
| Minimum | 25.8% | 48.9% |
| Maximum | 100.0% | 91.0% |
| Range | 74.2% | 42.1% |
| Mean | 74.3% | 67.1% |
| Median | 73.9% | 66.2% |
| Interquartile 25% (IQ1) | 66.1% | 62.7% |
| Interquartile 75% (IQ3) | 80.8% | 70.6% |
| Interquartile Range (IQR) | 14.7% | 7.9% |
| Standard Deviation (Sample) | 12.7% | 6.8% |
| Standard Deviation (Population) | 12.7% | 6.8% |
Similar Demographics by Family Households
Demographics Similar to Immigrants from Central America by Family Households
In terms of family households, the demographic groups most similar to Immigrants from Central America are Korean (68.3%, a difference of 0.030%), Immigrants from Philippines (68.3%, a difference of 0.070%), Pueblo (68.2%, a difference of 0.11%), Immigrants from Cuba (68.2%, a difference of 0.12%), and Native Hawaiian (68.4%, a difference of 0.14%).
| Demographics | Rating | Rank | Family Households |
| Yakama | 100.0 /100 | #4 | Exceptional 69.3% |
| Yuman | 100.0 /100 | #5 | Exceptional 69.3% |
| Immigrants | Mexico | 100.0 /100 | #6 | Exceptional 69.1% |
| Mexicans | 100.0 /100 | #7 | Exceptional 69.0% |
| Immigrants | Fiji | 100.0 /100 | #8 | Exceptional 68.8% |
| Native Hawaiians | 100.0 /100 | #9 | Exceptional 68.4% |
| Immigrants | Philippines | 100.0 /100 | #10 | Exceptional 68.3% |
| Immigrants | Central America | 100.0 /100 | #11 | Exceptional 68.3% |
| Koreans | 100.0 /100 | #12 | Exceptional 68.3% |
| Pueblo | 100.0 /100 | #13 | Exceptional 68.2% |
| Immigrants | Cuba | 100.0 /100 | #14 | Exceptional 68.2% |
| Assyrians/Chaldeans/Syriacs | 100.0 /100 | #15 | Exceptional 68.2% |
| Immigrants | Vietnam | 100.0 /100 | #16 | Exceptional 68.2% |
| Chinese | 100.0 /100 | #17 | Exceptional 68.1% |
| Immigrants | Taiwan | 100.0 /100 | #18 | Exceptional 68.0% |
Demographics Similar to Jamaicans by Family Households
In terms of family households, the demographic groups most similar to Jamaicans are Immigrants from Micronesia (64.2%, a difference of 0.020%), Immigrants from Ukraine (64.2%, a difference of 0.030%), Vietnamese (64.2%, a difference of 0.040%), Bangladeshi (64.3%, a difference of 0.050%), and Immigrants from Honduras (64.2%, a difference of 0.080%).
| Demographics | Rating | Rank | Family Households |
| Ute | 54.6 /100 | #171 | Average 64.3% |
| Dutch West Indians | 53.9 /100 | #172 | Average 64.3% |
| Immigrants | Sierra Leone | 52.5 /100 | #173 | Average 64.3% |
| Immigrants | Germany | 50.0 /100 | #174 | Average 64.3% |
| Bangladeshis | 44.3 /100 | #175 | Average 64.3% |
| Vietnamese | 43.6 /100 | #176 | Average 64.2% |
| Immigrants | Micronesia | 42.3 /100 | #177 | Average 64.2% |
| Jamaicans | 40.6 /100 | #178 | Average 64.2% |
| Immigrants | Ukraine | 38.2 /100 | #179 | Fair 64.2% |
| Immigrants | Honduras | 35.0 /100 | #180 | Fair 64.2% |
| Immigrants | Trinidad and Tobago | 34.9 /100 | #181 | Fair 64.2% |
| Ukrainians | 34.6 /100 | #182 | Fair 64.2% |
| Creek | 34.1 /100 | #183 | Fair 64.2% |
| Puerto Ricans | 33.4 /100 | #184 | Fair 64.2% |
| Immigrants | Iran | 30.4 /100 | #185 | Fair 64.1% |