Lumbee vs Jamaican Family Households
COMPARE
Lumbee
Jamaican
Family Households
Family Households Comparison
Lumbee
Jamaicans
63.1%
FAMILY HOUSEHOLDS
0.3/ 100
METRIC RATING
274th/ 347
METRIC RANK
64.2%
FAMILY HOUSEHOLDS
40.6/ 100
METRIC RATING
178th/ 347
METRIC RANK
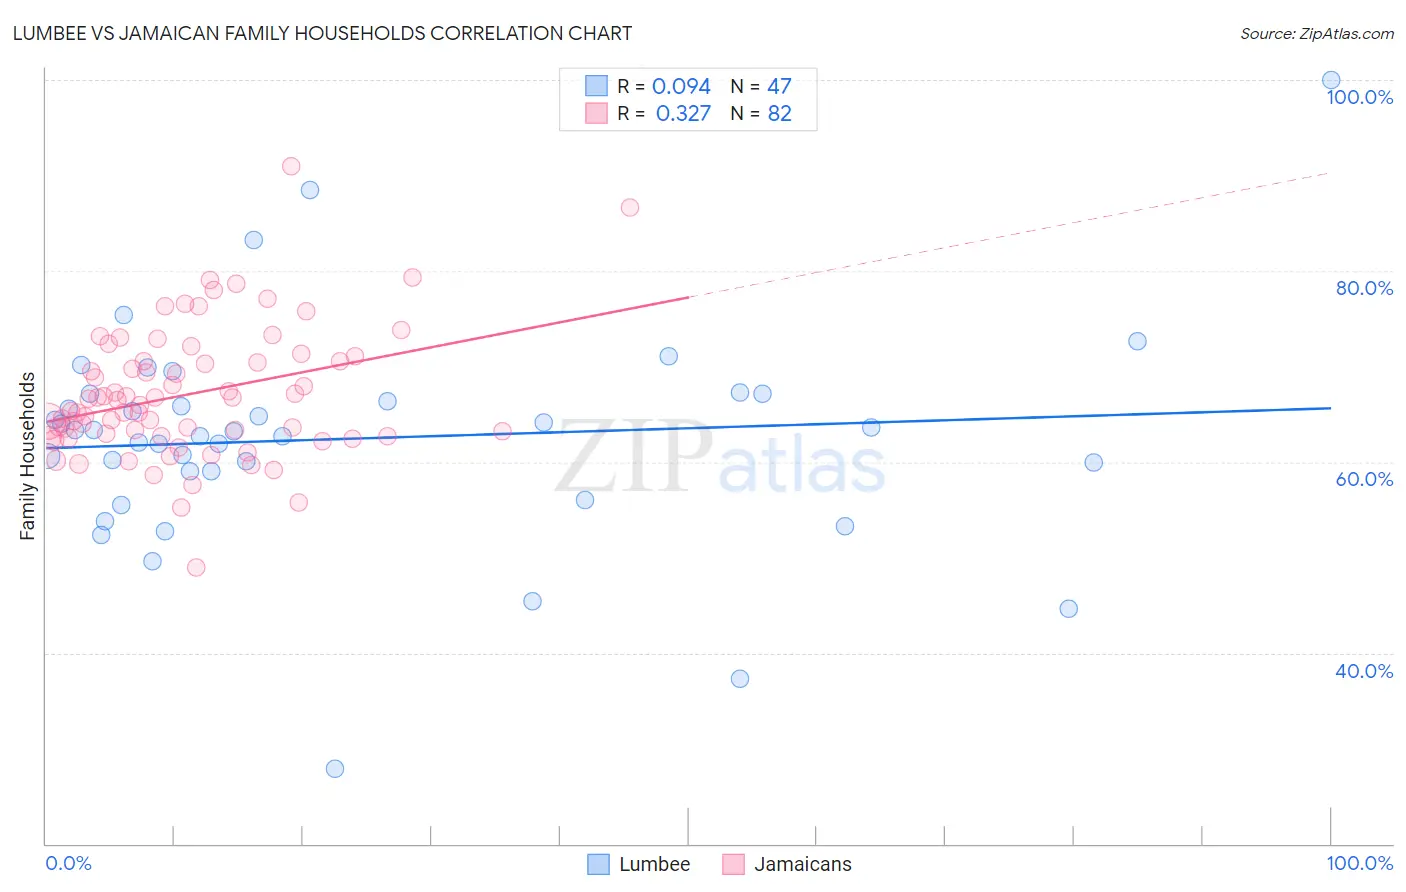
Lumbee vs Jamaican Family Households Correlation Chart
The statistical analysis conducted on geographies consisting of 92,265,071 people shows a slight positive correlation between the proportion of Lumbee and percentage of family households in the United States with a correlation coefficient (R) of 0.094 and weighted average of 63.1%. Similarly, the statistical analysis conducted on geographies consisting of 367,646,383 people shows a mild positive correlation between the proportion of Jamaicans and percentage of family households in the United States with a correlation coefficient (R) of 0.327 and weighted average of 64.2%, a difference of 1.8%.
Family Households Correlation Summary
| Measurement | Lumbee | Jamaican |
| Minimum | 27.9% | 48.9% |
| Maximum | 100.0% | 91.0% |
| Range | 72.1% | 42.1% |
| Mean | 62.4% | 67.1% |
| Median | 63.1% | 66.2% |
| Interquartile 25% (IQ1) | 59.0% | 62.7% |
| Interquartile 75% (IQ3) | 67.2% | 70.6% |
| Interquartile Range (IQR) | 8.2% | 7.9% |
| Standard Deviation (Sample) | 11.7% | 6.8% |
| Standard Deviation (Population) | 11.5% | 6.8% |
Similar Demographics by Family Households
Demographics Similar to Lumbee by Family Households
In terms of family households, the demographic groups most similar to Lumbee are West Indian (63.1%, a difference of 0.0%), Immigrants from Kazakhstan (63.1%, a difference of 0.010%), Serbian (63.0%, a difference of 0.010%), Immigrants from Croatia (63.1%, a difference of 0.020%), and Immigrants from Turkey (63.1%, a difference of 0.020%).
| Demographics | Rating | Rank | Family Households |
| Israelis | 0.4 /100 | #267 | Tragic 63.1% |
| Immigrants | Singapore | 0.4 /100 | #268 | Tragic 63.1% |
| Yugoslavians | 0.4 /100 | #269 | Tragic 63.1% |
| Immigrants | Austria | 0.3 /100 | #270 | Tragic 63.1% |
| Immigrants | Croatia | 0.3 /100 | #271 | Tragic 63.1% |
| Immigrants | Turkey | 0.3 /100 | #272 | Tragic 63.1% |
| Immigrants | Kazakhstan | 0.3 /100 | #273 | Tragic 63.1% |
| Lumbee | 0.3 /100 | #274 | Tragic 63.1% |
| West Indians | 0.3 /100 | #275 | Tragic 63.1% |
| Serbians | 0.3 /100 | #276 | Tragic 63.0% |
| Ottawa | 0.3 /100 | #277 | Tragic 63.0% |
| Immigrants | Belgium | 0.2 /100 | #278 | Tragic 63.0% |
| Immigrants | Yemen | 0.2 /100 | #279 | Tragic 63.0% |
| Immigrants | Bulgaria | 0.2 /100 | #280 | Tragic 63.0% |
| Estonians | 0.2 /100 | #281 | Tragic 62.9% |
Demographics Similar to Jamaicans by Family Households
In terms of family households, the demographic groups most similar to Jamaicans are Immigrants from Micronesia (64.2%, a difference of 0.020%), Immigrants from Ukraine (64.2%, a difference of 0.030%), Vietnamese (64.2%, a difference of 0.040%), Bangladeshi (64.3%, a difference of 0.050%), and Immigrants from Honduras (64.2%, a difference of 0.080%).
| Demographics | Rating | Rank | Family Households |
| Ute | 54.6 /100 | #171 | Average 64.3% |
| Dutch West Indians | 53.9 /100 | #172 | Average 64.3% |
| Immigrants | Sierra Leone | 52.5 /100 | #173 | Average 64.3% |
| Immigrants | Germany | 50.0 /100 | #174 | Average 64.3% |
| Bangladeshis | 44.3 /100 | #175 | Average 64.3% |
| Vietnamese | 43.6 /100 | #176 | Average 64.2% |
| Immigrants | Micronesia | 42.3 /100 | #177 | Average 64.2% |
| Jamaicans | 40.6 /100 | #178 | Average 64.2% |
| Immigrants | Ukraine | 38.2 /100 | #179 | Fair 64.2% |
| Immigrants | Honduras | 35.0 /100 | #180 | Fair 64.2% |
| Immigrants | Trinidad and Tobago | 34.9 /100 | #181 | Fair 64.2% |
| Ukrainians | 34.6 /100 | #182 | Fair 64.2% |
| Creek | 34.1 /100 | #183 | Fair 64.2% |
| Puerto Ricans | 33.4 /100 | #184 | Fair 64.2% |
| Immigrants | Iran | 30.4 /100 | #185 | Fair 64.1% |