Immigrants from Indonesia vs Jamaican Family Households
COMPARE
Immigrants from Indonesia
Jamaican
Family Households
Family Households Comparison
Immigrants from Indonesia
Jamaicans
66.0%
FAMILY HOUSEHOLDS
100.0/ 100
METRIC RATING
63rd/ 347
METRIC RANK
64.2%
FAMILY HOUSEHOLDS
40.6/ 100
METRIC RATING
178th/ 347
METRIC RANK
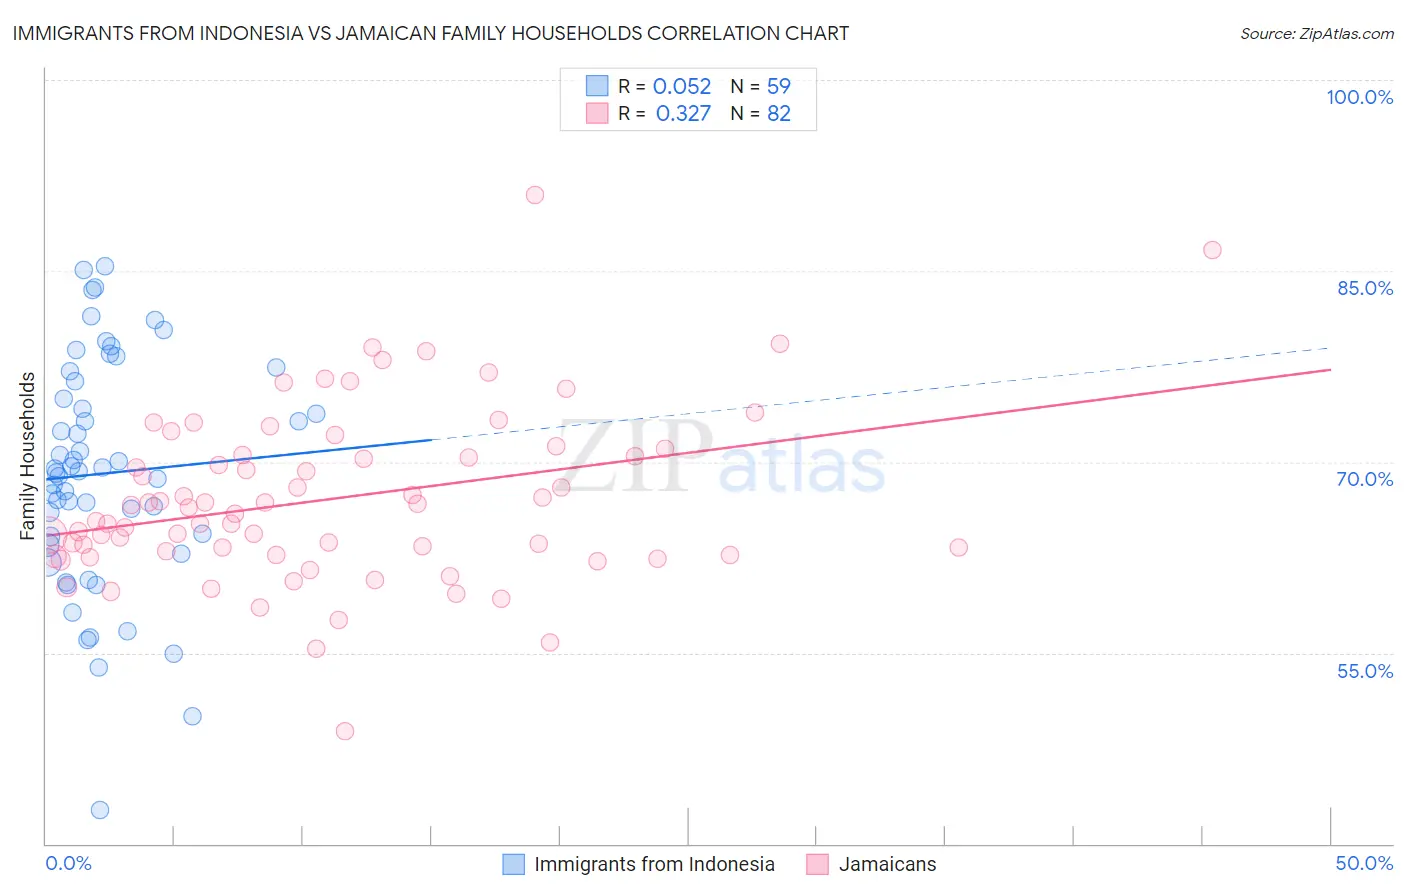
Immigrants from Indonesia vs Jamaican Family Households Correlation Chart
The statistical analysis conducted on geographies consisting of 215,720,751 people shows a slight positive correlation between the proportion of Immigrants from Indonesia and percentage of family households in the United States with a correlation coefficient (R) of 0.052 and weighted average of 66.0%. Similarly, the statistical analysis conducted on geographies consisting of 367,646,383 people shows a mild positive correlation between the proportion of Jamaicans and percentage of family households in the United States with a correlation coefficient (R) of 0.327 and weighted average of 64.2%, a difference of 2.8%.
Family Households Correlation Summary
| Measurement | Immigrants from Indonesia | Jamaican |
| Minimum | 42.7% | 48.9% |
| Maximum | 85.4% | 91.0% |
| Range | 42.7% | 42.1% |
| Mean | 69.1% | 67.1% |
| Median | 69.3% | 66.2% |
| Interquartile 25% (IQ1) | 63.4% | 62.7% |
| Interquartile 75% (IQ3) | 76.3% | 70.6% |
| Interquartile Range (IQR) | 12.9% | 7.9% |
| Standard Deviation (Sample) | 9.1% | 6.8% |
| Standard Deviation (Population) | 9.0% | 6.8% |
Similar Demographics by Family Households
Demographics Similar to Immigrants from Indonesia by Family Households
In terms of family households, the demographic groups most similar to Immigrants from Indonesia are Central American (66.0%, a difference of 0.040%), Pima (65.9%, a difference of 0.060%), Danish (66.0%, a difference of 0.070%), Costa Rican (65.9%, a difference of 0.070%), and South American (66.0%, a difference of 0.090%).
| Demographics | Rating | Rank | Family Households |
| Immigrants | Hong Kong | 100.0 /100 | #56 | Exceptional 66.1% |
| Pennsylvania Germans | 100.0 /100 | #57 | Exceptional 66.1% |
| Immigrants | Asia | 100.0 /100 | #58 | Exceptional 66.1% |
| Immigrants | Korea | 100.0 /100 | #59 | Exceptional 66.0% |
| South Americans | 100.0 /100 | #60 | Exceptional 66.0% |
| Danes | 100.0 /100 | #61 | Exceptional 66.0% |
| Central Americans | 100.0 /100 | #62 | Exceptional 66.0% |
| Immigrants | Indonesia | 100.0 /100 | #63 | Exceptional 66.0% |
| Pima | 99.9 /100 | #64 | Exceptional 65.9% |
| Costa Ricans | 99.9 /100 | #65 | Exceptional 65.9% |
| Fijians | 99.9 /100 | #66 | Exceptional 65.9% |
| Filipinos | 99.9 /100 | #67 | Exceptional 65.9% |
| Japanese | 99.9 /100 | #68 | Exceptional 65.9% |
| Malaysians | 99.9 /100 | #69 | Exceptional 65.9% |
| Immigrants | Afghanistan | 99.9 /100 | #70 | Exceptional 65.9% |
Demographics Similar to Jamaicans by Family Households
In terms of family households, the demographic groups most similar to Jamaicans are Immigrants from Micronesia (64.2%, a difference of 0.020%), Immigrants from Ukraine (64.2%, a difference of 0.030%), Vietnamese (64.2%, a difference of 0.040%), Bangladeshi (64.3%, a difference of 0.050%), and Immigrants from Honduras (64.2%, a difference of 0.080%).
| Demographics | Rating | Rank | Family Households |
| Ute | 54.6 /100 | #171 | Average 64.3% |
| Dutch West Indians | 53.9 /100 | #172 | Average 64.3% |
| Immigrants | Sierra Leone | 52.5 /100 | #173 | Average 64.3% |
| Immigrants | Germany | 50.0 /100 | #174 | Average 64.3% |
| Bangladeshis | 44.3 /100 | #175 | Average 64.3% |
| Vietnamese | 43.6 /100 | #176 | Average 64.2% |
| Immigrants | Micronesia | 42.3 /100 | #177 | Average 64.2% |
| Jamaicans | 40.6 /100 | #178 | Average 64.2% |
| Immigrants | Ukraine | 38.2 /100 | #179 | Fair 64.2% |
| Immigrants | Honduras | 35.0 /100 | #180 | Fair 64.2% |
| Immigrants | Trinidad and Tobago | 34.9 /100 | #181 | Fair 64.2% |
| Ukrainians | 34.6 /100 | #182 | Fair 64.2% |
| Creek | 34.1 /100 | #183 | Fair 64.2% |
| Puerto Ricans | 33.4 /100 | #184 | Fair 64.2% |
| Immigrants | Iran | 30.4 /100 | #185 | Fair 64.1% |