Immigrants from Italy vs Jamaican Family Households
COMPARE
Immigrants from Italy
Jamaican
Family Households
Family Households Comparison
Immigrants from Italy
Jamaicans
64.8%
FAMILY HOUSEHOLDS
90.2/ 100
METRIC RATING
130th/ 347
METRIC RANK
64.2%
FAMILY HOUSEHOLDS
40.6/ 100
METRIC RATING
178th/ 347
METRIC RANK
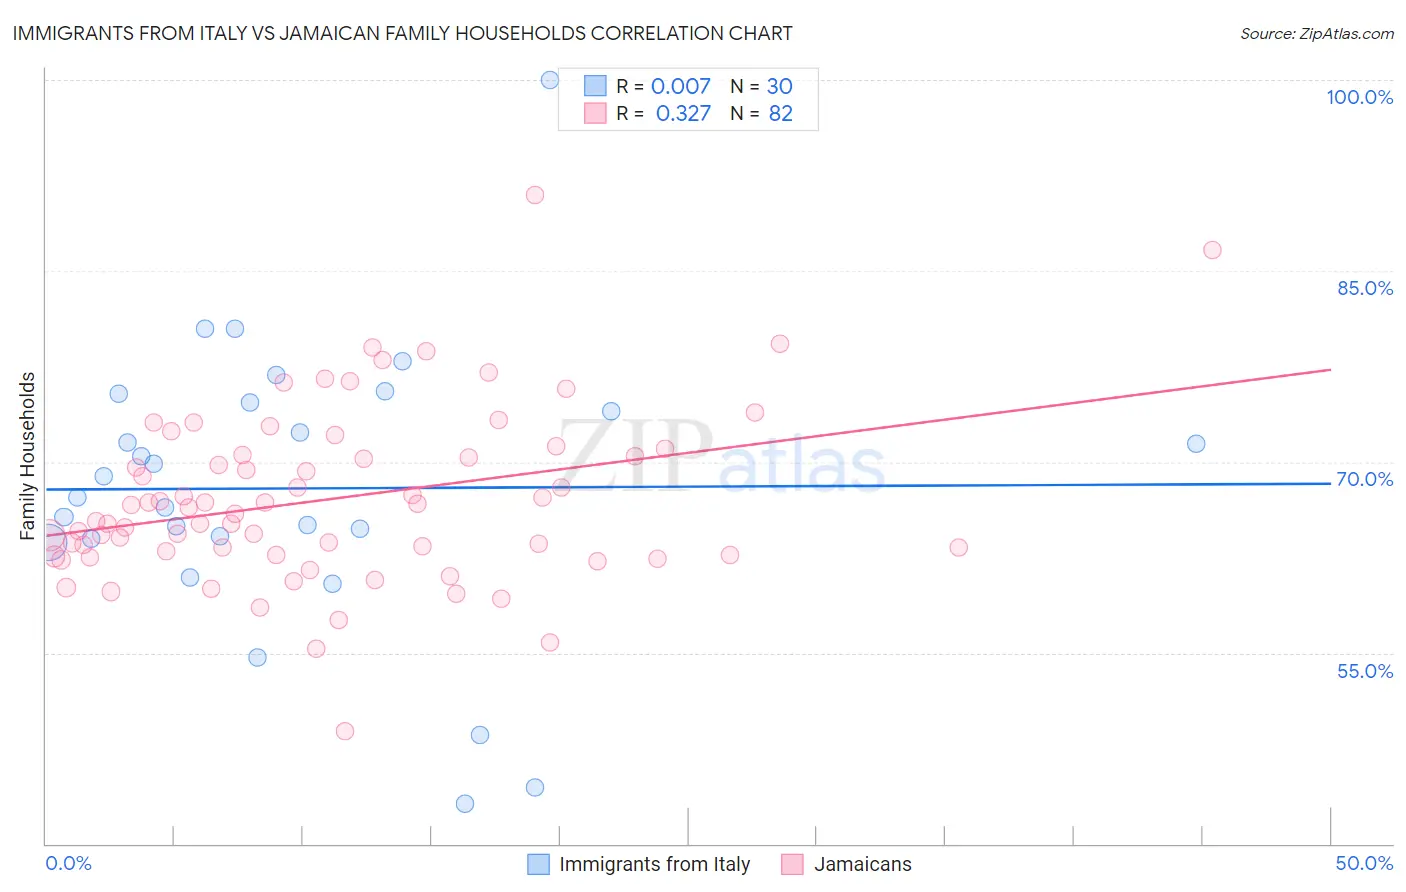
Immigrants from Italy vs Jamaican Family Households Correlation Chart
The statistical analysis conducted on geographies consisting of 324,146,705 people shows no correlation between the proportion of Immigrants from Italy and percentage of family households in the United States with a correlation coefficient (R) of 0.007 and weighted average of 64.8%. Similarly, the statistical analysis conducted on geographies consisting of 367,646,383 people shows a mild positive correlation between the proportion of Jamaicans and percentage of family households in the United States with a correlation coefficient (R) of 0.327 and weighted average of 64.2%, a difference of 0.88%.
Family Households Correlation Summary
| Measurement | Immigrants from Italy | Jamaican |
| Minimum | 43.1% | 48.9% |
| Maximum | 100.0% | 91.0% |
| Range | 56.9% | 42.1% |
| Mean | 67.9% | 67.1% |
| Median | 68.1% | 66.2% |
| Interquartile 25% (IQ1) | 63.9% | 62.7% |
| Interquartile 75% (IQ3) | 74.7% | 70.6% |
| Interquartile Range (IQR) | 10.7% | 7.9% |
| Standard Deviation (Sample) | 11.3% | 6.8% |
| Standard Deviation (Population) | 11.1% | 6.8% |
Similar Demographics by Family Households
Demographics Similar to Immigrants from Italy by Family Households
In terms of family households, the demographic groups most similar to Immigrants from Italy are Nonimmigrants (64.8%, a difference of 0.010%), Cajun (64.8%, a difference of 0.030%), Belizean (64.8%, a difference of 0.040%), Immigrants from Ecuador (64.8%, a difference of 0.050%), and Immigrants from Panama (64.8%, a difference of 0.070%).
| Demographics | Rating | Rank | Family Households |
| Choctaw | 93.4 /100 | #123 | Exceptional 64.9% |
| Immigrants | Argentina | 92.8 /100 | #124 | Exceptional 64.9% |
| Immigrants | Belize | 92.7 /100 | #125 | Exceptional 64.9% |
| Panamanians | 92.4 /100 | #126 | Exceptional 64.8% |
| Immigrants | Panama | 92.0 /100 | #127 | Exceptional 64.8% |
| Italians | 91.9 /100 | #128 | Exceptional 64.8% |
| Immigrants | Ecuador | 91.4 /100 | #129 | Exceptional 64.8% |
| Immigrants | Italy | 90.2 /100 | #130 | Exceptional 64.8% |
| Immigrants | Nonimmigrants | 90.1 /100 | #131 | Exceptional 64.8% |
| Cajuns | 89.4 /100 | #132 | Excellent 64.8% |
| Belizeans | 89.3 /100 | #133 | Excellent 64.8% |
| Greeks | 88.1 /100 | #134 | Excellent 64.7% |
| Maltese | 87.4 /100 | #135 | Excellent 64.7% |
| Immigrants | China | 86.6 /100 | #136 | Excellent 64.7% |
| Immigrants | Scotland | 86.4 /100 | #137 | Excellent 64.7% |
Demographics Similar to Jamaicans by Family Households
In terms of family households, the demographic groups most similar to Jamaicans are Immigrants from Micronesia (64.2%, a difference of 0.020%), Immigrants from Ukraine (64.2%, a difference of 0.030%), Vietnamese (64.2%, a difference of 0.040%), Bangladeshi (64.3%, a difference of 0.050%), and Immigrants from Honduras (64.2%, a difference of 0.080%).
| Demographics | Rating | Rank | Family Households |
| Ute | 54.6 /100 | #171 | Average 64.3% |
| Dutch West Indians | 53.9 /100 | #172 | Average 64.3% |
| Immigrants | Sierra Leone | 52.5 /100 | #173 | Average 64.3% |
| Immigrants | Germany | 50.0 /100 | #174 | Average 64.3% |
| Bangladeshis | 44.3 /100 | #175 | Average 64.3% |
| Vietnamese | 43.6 /100 | #176 | Average 64.2% |
| Immigrants | Micronesia | 42.3 /100 | #177 | Average 64.2% |
| Jamaicans | 40.6 /100 | #178 | Average 64.2% |
| Immigrants | Ukraine | 38.2 /100 | #179 | Fair 64.2% |
| Immigrants | Honduras | 35.0 /100 | #180 | Fair 64.2% |
| Immigrants | Trinidad and Tobago | 34.9 /100 | #181 | Fair 64.2% |
| Ukrainians | 34.6 /100 | #182 | Fair 64.2% |
| Creek | 34.1 /100 | #183 | Fair 64.2% |
| Puerto Ricans | 33.4 /100 | #184 | Fair 64.2% |
| Immigrants | Iran | 30.4 /100 | #185 | Fair 64.1% |