Immigrants from Laos vs Immigrants from Brazil Married-couple Households
COMPARE
Immigrants from Laos
Immigrants from Brazil
Married-couple Households
Married-couple Households Comparison
Immigrants from Laos
Immigrants from Brazil
45.1%
MARRIED-COUPLE HOUSEHOLDS
4.6/ 100
METRIC RATING
222nd/ 347
METRIC RANK
46.2%
MARRIED-COUPLE HOUSEHOLDS
38.3/ 100
METRIC RATING
183rd/ 347
METRIC RANK
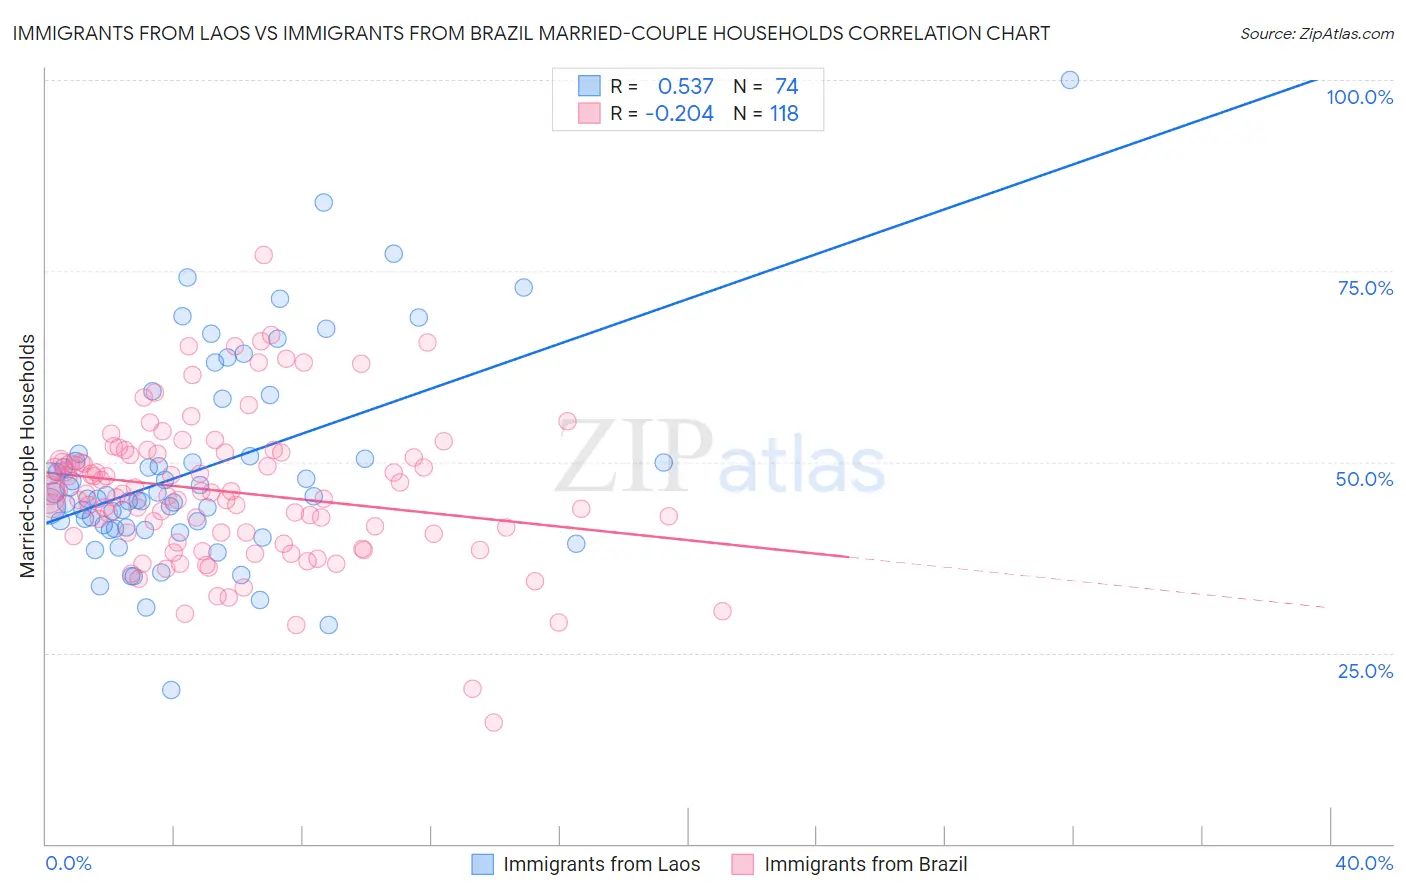
Immigrants from Laos vs Immigrants from Brazil Married-couple Households Correlation Chart
The statistical analysis conducted on geographies consisting of 201,468,663 people shows a substantial positive correlation between the proportion of Immigrants from Laos and percentage of married-couple family households in the United States with a correlation coefficient (R) of 0.537 and weighted average of 45.1%. Similarly, the statistical analysis conducted on geographies consisting of 342,850,397 people shows a weak negative correlation between the proportion of Immigrants from Brazil and percentage of married-couple family households in the United States with a correlation coefficient (R) of -0.204 and weighted average of 46.2%, a difference of 2.5%.
Married-couple Households Correlation Summary
| Measurement | Immigrants from Laos | Immigrants from Brazil |
| Minimum | 20.1% | 15.8% |
| Maximum | 100.0% | 77.1% |
| Range | 79.9% | 61.3% |
| Mean | 49.0% | 46.1% |
| Median | 45.4% | 45.9% |
| Interquartile 25% (IQ1) | 41.5% | 40.2% |
| Interquartile 75% (IQ3) | 50.7% | 51.0% |
| Interquartile Range (IQR) | 9.2% | 10.8% |
| Standard Deviation (Sample) | 13.5% | 9.6% |
| Standard Deviation (Population) | 13.4% | 9.6% |
Similar Demographics by Married-couple Households
Demographics Similar to Immigrants from Laos by Married-couple Households
In terms of married-couple households, the demographic groups most similar to Immigrants from Laos are Tlingit-Haida (45.1%, a difference of 0.050%), Immigrants from Thailand (45.2%, a difference of 0.10%), Nicaraguan (45.2%, a difference of 0.13%), Immigrants from the Azores (45.2%, a difference of 0.14%), and Panamanian (45.2%, a difference of 0.17%).
| Demographics | Rating | Rank | Married-couple Households |
| Immigrants | Nepal | 5.6 /100 | #215 | Tragic 45.2% |
| Immigrants | Portugal | 5.6 /100 | #216 | Tragic 45.2% |
| Panamanians | 5.5 /100 | #217 | Tragic 45.2% |
| Immigrants | Azores | 5.3 /100 | #218 | Tragic 45.2% |
| Nicaraguans | 5.3 /100 | #219 | Tragic 45.2% |
| Immigrants | Thailand | 5.1 /100 | #220 | Tragic 45.2% |
| Tlingit-Haida | 4.9 /100 | #221 | Tragic 45.1% |
| Immigrants | Laos | 4.6 /100 | #222 | Tragic 45.1% |
| Immigrants | Cambodia | 2.7 /100 | #223 | Tragic 44.9% |
| Immigrants | Micronesia | 2.6 /100 | #224 | Tragic 44.9% |
| Dutch West Indians | 2.6 /100 | #225 | Tragic 44.9% |
| Alsatians | 2.3 /100 | #226 | Tragic 44.8% |
| Salvadorans | 1.9 /100 | #227 | Tragic 44.7% |
| Kenyans | 1.7 /100 | #228 | Tragic 44.7% |
| Immigrants | Latin America | 1.6 /100 | #229 | Tragic 44.7% |
Demographics Similar to Immigrants from Brazil by Married-couple Households
In terms of married-couple households, the demographic groups most similar to Immigrants from Brazil are Yugoslavian (46.2%, a difference of 0.020%), Immigrants from Switzerland (46.2%, a difference of 0.060%), Brazilian (46.2%, a difference of 0.10%), Malaysian (46.3%, a difference of 0.14%), and Mongolian (46.3%, a difference of 0.15%).
| Demographics | Rating | Rank | Married-couple Households |
| Cajuns | 45.2 /100 | #176 | Average 46.4% |
| Immigrants | Immigrants | 43.8 /100 | #177 | Average 46.3% |
| Immigrants | Costa Rica | 43.4 /100 | #178 | Average 46.3% |
| Immigrants | Zimbabwe | 43.0 /100 | #179 | Average 46.3% |
| Mongolians | 42.0 /100 | #180 | Average 46.3% |
| Malaysians | 41.8 /100 | #181 | Average 46.3% |
| Yugoslavians | 38.9 /100 | #182 | Fair 46.2% |
| Immigrants | Brazil | 38.3 /100 | #183 | Fair 46.2% |
| Immigrants | Switzerland | 36.9 /100 | #184 | Fair 46.2% |
| Brazilians | 35.9 /100 | #185 | Fair 46.2% |
| Albanians | 31.1 /100 | #186 | Fair 46.1% |
| Fijians | 29.2 /100 | #187 | Fair 46.1% |
| South American Indians | 28.4 /100 | #188 | Fair 46.0% |
| Immigrants | Latvia | 26.9 /100 | #189 | Fair 46.0% |
| Immigrants | Kuwait | 25.6 /100 | #190 | Fair 46.0% |