Immigrants from Barbados vs Immigrants from Brazil Married-couple Households
COMPARE
Immigrants from Barbados
Immigrants from Brazil
Married-couple Households
Married-couple Households Comparison
Immigrants from Barbados
Immigrants from Brazil
39.2%
MARRIED-COUPLE HOUSEHOLDS
0.0/ 100
METRIC RATING
330th/ 347
METRIC RANK
46.2%
MARRIED-COUPLE HOUSEHOLDS
38.3/ 100
METRIC RATING
183rd/ 347
METRIC RANK
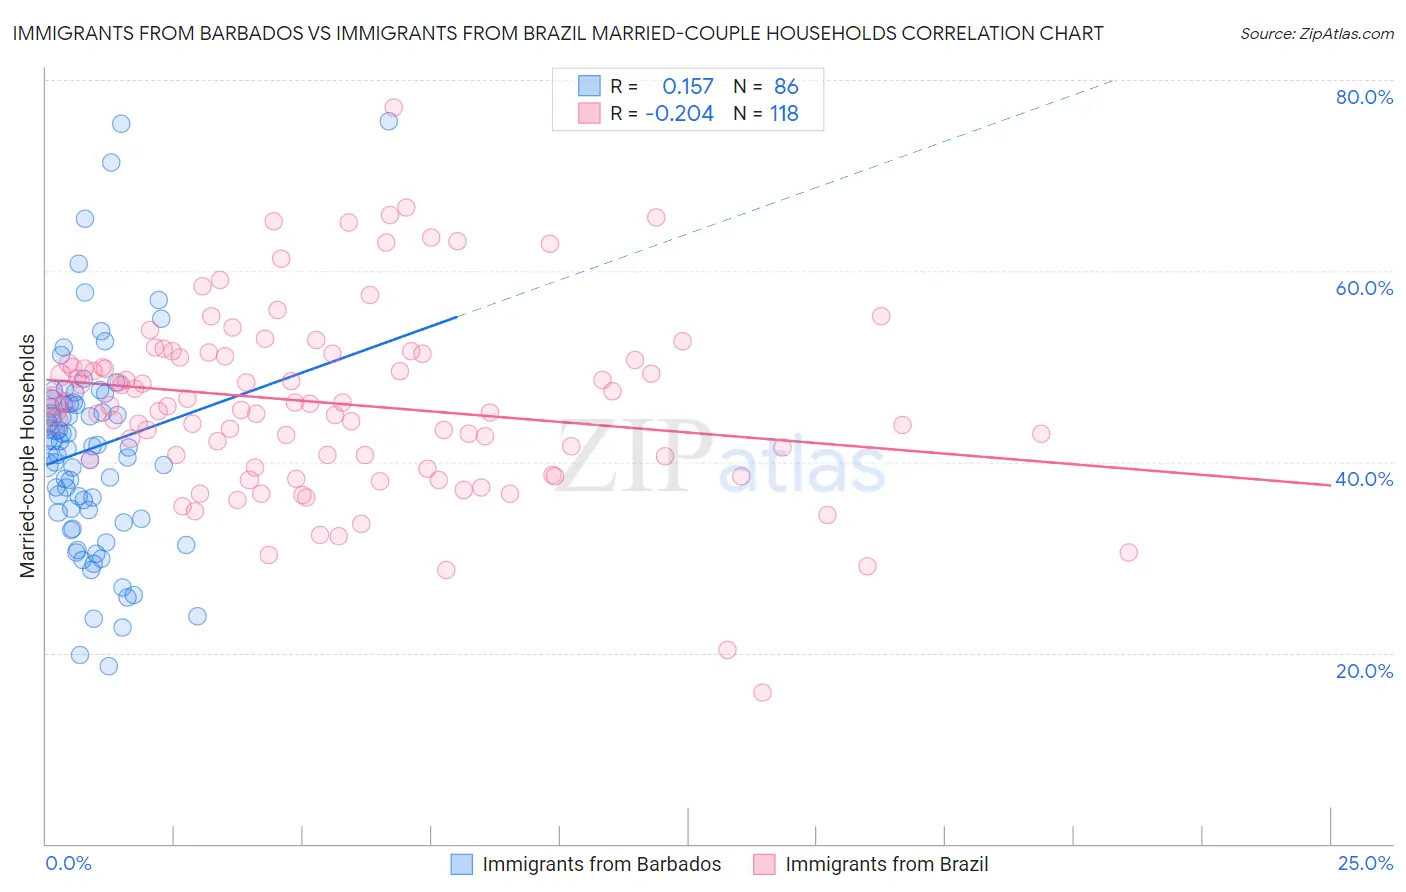
Immigrants from Barbados vs Immigrants from Brazil Married-couple Households Correlation Chart
The statistical analysis conducted on geographies consisting of 112,771,790 people shows a poor positive correlation between the proportion of Immigrants from Barbados and percentage of married-couple family households in the United States with a correlation coefficient (R) of 0.157 and weighted average of 39.2%. Similarly, the statistical analysis conducted on geographies consisting of 342,850,397 people shows a weak negative correlation between the proportion of Immigrants from Brazil and percentage of married-couple family households in the United States with a correlation coefficient (R) of -0.204 and weighted average of 46.2%, a difference of 17.9%.
Married-couple Households Correlation Summary
| Measurement | Immigrants from Barbados | Immigrants from Brazil |
| Minimum | 18.6% | 15.8% |
| Maximum | 75.7% | 77.1% |
| Range | 57.1% | 61.3% |
| Mean | 41.4% | 46.1% |
| Median | 41.6% | 45.9% |
| Interquartile 25% (IQ1) | 34.8% | 40.2% |
| Interquartile 75% (IQ3) | 46.1% | 51.0% |
| Interquartile Range (IQR) | 11.3% | 10.8% |
| Standard Deviation (Sample) | 11.0% | 9.6% |
| Standard Deviation (Population) | 10.9% | 9.6% |
Similar Demographics by Married-couple Households
Demographics Similar to Immigrants from Barbados by Married-couple Households
In terms of married-couple households, the demographic groups most similar to Immigrants from Barbados are Immigrants from Dominica (39.4%, a difference of 0.44%), Immigrants from Congo (39.0%, a difference of 0.44%), Barbadian (39.4%, a difference of 0.52%), Somali (39.0%, a difference of 0.52%), and Immigrants from West Indies (39.0%, a difference of 0.56%).
| Demographics | Rating | Rank | Married-couple Households |
| Puerto Ricans | 0.0 /100 | #323 | Tragic 40.1% |
| Navajo | 0.0 /100 | #324 | Tragic 40.1% |
| Pueblo | 0.0 /100 | #325 | Tragic 40.0% |
| U.S. Virgin Islanders | 0.0 /100 | #326 | Tragic 39.8% |
| Lumbee | 0.0 /100 | #327 | Tragic 39.6% |
| Barbadians | 0.0 /100 | #328 | Tragic 39.4% |
| Immigrants | Dominica | 0.0 /100 | #329 | Tragic 39.4% |
| Immigrants | Barbados | 0.0 /100 | #330 | Tragic 39.2% |
| Immigrants | Congo | 0.0 /100 | #331 | Tragic 39.0% |
| Somalis | 0.0 /100 | #332 | Tragic 39.0% |
| Immigrants | West Indies | 0.0 /100 | #333 | Tragic 39.0% |
| Immigrants | St. Vincent and the Grenadines | 0.0 /100 | #334 | Tragic 38.7% |
| Senegalese | 0.0 /100 | #335 | Tragic 38.6% |
| Blacks/African Americans | 0.0 /100 | #336 | Tragic 38.5% |
| Immigrants | Somalia | 0.0 /100 | #337 | Tragic 38.4% |
Demographics Similar to Immigrants from Brazil by Married-couple Households
In terms of married-couple households, the demographic groups most similar to Immigrants from Brazil are Yugoslavian (46.2%, a difference of 0.020%), Immigrants from Switzerland (46.2%, a difference of 0.060%), Brazilian (46.2%, a difference of 0.10%), Malaysian (46.3%, a difference of 0.14%), and Mongolian (46.3%, a difference of 0.15%).
| Demographics | Rating | Rank | Married-couple Households |
| Cajuns | 45.2 /100 | #176 | Average 46.4% |
| Immigrants | Immigrants | 43.8 /100 | #177 | Average 46.3% |
| Immigrants | Costa Rica | 43.4 /100 | #178 | Average 46.3% |
| Immigrants | Zimbabwe | 43.0 /100 | #179 | Average 46.3% |
| Mongolians | 42.0 /100 | #180 | Average 46.3% |
| Malaysians | 41.8 /100 | #181 | Average 46.3% |
| Yugoslavians | 38.9 /100 | #182 | Fair 46.2% |
| Immigrants | Brazil | 38.3 /100 | #183 | Fair 46.2% |
| Immigrants | Switzerland | 36.9 /100 | #184 | Fair 46.2% |
| Brazilians | 35.9 /100 | #185 | Fair 46.2% |
| Albanians | 31.1 /100 | #186 | Fair 46.1% |
| Fijians | 29.2 /100 | #187 | Fair 46.1% |
| South American Indians | 28.4 /100 | #188 | Fair 46.0% |
| Immigrants | Latvia | 26.9 /100 | #189 | Fair 46.0% |
| Immigrants | Kuwait | 25.6 /100 | #190 | Fair 46.0% |